
The Chart Whisperer’s Secret: How the Unemployment Rate Predicts the Inverse Head and Shoulders Pattern
There are two kinds of traders in this world: those who wait for textbook setups like a chef waiting for the perfect avocado ripeness—and those who can smell a reversal before it even shows up on the chart.
If you’re here, you’re probably tired of trading guides that promise Fibonacci enlightenment and leave you staring at your screen wondering why price just did the Cha-Cha.
Let’s change that. This isn’t about generic setups. This is about how the unemployment rate – that dry economic stat you usually skip over – can become your secret weapon to forecast one of the most powerful reversal signals in the game: the inverse head and shoulders pattern.
The Market Move Most Traders Miss
Most traders either:
- React to price AFTER the unemployment report is out.
- Or worse, avoid trading on NFP week because “volatility scares me.”
But what if I told you seasoned pros actually predict chart patterns using unemployment trends?
You heard that right. Certain shifts in the labor market quietly set the stage for accumulation phases — the very breeding ground for inverse head and shoulders formations.
The Secret Sauce: Why the Unemployment Rate Actually Matters
Contrary to popular belief, the unemployment rate isn’t just an economist’s plaything. It’s the macro canary in the coal mine. Here’s why:
- Declining unemployment = rising economic confidence
- Rising confidence = stronger consumer demand
- Stronger demand = institutional accumulation
- Institutional accumulation = reversal patterns forming beneath your nose
And when institutional money gets to work, that’s when the left shoulder starts forming.
Data-Backed Insight: According to the U.S. Bureau of Labor Statistics, when unemployment fell below 5% in mid-2023, pairs like USD/JPY and GBP/USD both printed textbook inverse head and shoulders within 2-3 weeks—leading to +400 pip moves.
Hidden Pattern: What the Inverse Head and Shoulders Tells Us
Let’s break this down like a market ninja:
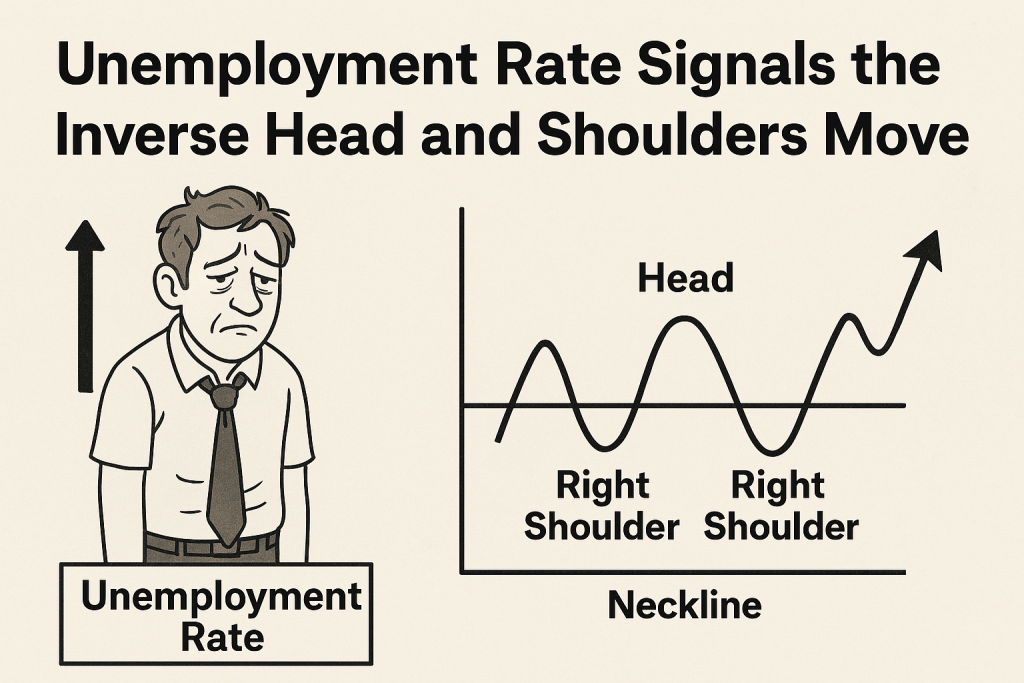
- Left Shoulder = Early signs of exhaustion. Sellers are confident, but buyers begin to stir.
- Head = Panic sell-off. Maybe unemployment spiked momentarily. Smart money steps in while retail traders scream into their pillows.
- Right Shoulder = Employment stabilizes. Institutions add to their positions. Retail traders are still licking wounds.
- Neckline Break = Confirmation. Your cue to strike like a caffeinated falcon.
Example: In November 2023, AUD/USD printed an inverse head and shoulders within days of the unemployment rate surprising to the downside (dropping from 3.8% to 3.5%).
Most traders were still doomscrolling macro news while sharp traders rode the +3.2% rally in under two weeks.
Contrarian Angle: Why Bad Employment News is Sometimes Bullish
Here’s the plot twist: sometimes, bad unemployment data is actually good news for reversal setups.
How?
- Weak data = Dovish central bank = Cheap money
- Cheap money = Risk-on flows
- Risk-on = Risk currencies (AUD, GBP, NZD) rally
- Rally = Inverse head and shoulders forming before your very eyes
Bonus Tip: Monitor forward guidance from central banks right after a weak labor report. The language shift is often the real catalyst.
The Playbook: How to Trade the IHS Around Unemployment Releases
- Step 1: Watch for employment trend divergence
- Look for falling unemployment but stagnant price action = stealth accumulation.
- Step 2: Map out the neckline early
- Connect swing highs across shoulders—watch for volume to spike around that line.
- Step 3: Time your entry
- Enter on the break and close above the neckline, ideally with unemployment data supporting the bullish narrative.
- Step 4: Manage like a pro
- Place your stop below the right shoulder, and target at least 1.5x risk.
Underground Trick: The Fractal Employment Pattern
Ready for a deep cut? There’s a lesser-known phenomenon where weekly jobless claims (released Thursdays in the U.S.) front-run monthly unemployment trends.
Fractal Setup:
- Series of lower weekly jobless claims = institutional optimism
- Inverse head and shoulders appear on lower timeframes (15M to 1H)
- Anticipate the higher timeframe reversal before retail even smells it
This is where the smart money gets in early. Before the Friday fireworks.
Real Case Study: EUR/USD & The Spring Job Shock
In April 2024, eurozone unemployment unexpectedly dropped from 6.5% to 6.2%.
EUR/USD had just finished printing an inverse head and shoulders on the daily timeframe. Smart traders who caught the neckline break at 1.0810 rode the rally to 1.1125 before the ECB even held their presser.
Retail traders? Still drawing trendlines and wondering why.
Why Most Traders Get It Wrong (And How You Can Flip the Script)
They treat the unemployment rate like background noise instead of a leading indicator.
They wait for confirmation, instead of understanding the why behind market moves.
They react. You? You’re about to pre-act.
Elite Tactics Recap
- Use the unemployment rate as a reversal precursor, not a lagging stat.
- Pair macro shifts with inverse head and shoulders patterns to anticipate bullish momentum.
- Watch jobless claims to forecast future unemployment trends and early pattern formation.
- Monitor central bank language for confirmation of risk-on transitions.
- Enter on neckline breaks with stops under right shoulders and risk-reward at 1:1.5+.
Want More Ninja-Level Plays Like This?
StarseedFX is your secret weapon:
- Stay informed with cutting-edge economic indicators and real-time Forex news: Forex News Today
- Learn elite strategies with our free Forex courses: Forex Education
- Get insider alerts & analysis by joining our expert community: StarseedFX Community
- Track smarter, trade sharper with our free trading plan: Free Trading Plan
- Refine your execution with our precision-based trading journal: Free Trading Journal
- Automate your precision with our Smart Trading Tool: Smart Trading Tool
—————–
Image Credits: Cover image at the top is AI-generated
PLEASE NOTE: This is not trading advice. It is educational content. Markets are influenced by numerous factors, and their reactions can vary each time.

Anne Durrell & Mo
About the Author
Anne Durrell (aka Anne Abouzeid), a former teacher, has a unique talent for transforming complex Forex concepts into something easy, accessible, and even fun. With a blend of humor and in-depth market insight, Anne makes learning about Forex both enlightening and entertaining. She began her trading journey alongside her husband, Mohamed Abouzeid, and they have now been trading full-time for over 12 years.
Anne loves writing and sharing her expertise. For those new to trading, she provides a variety of free forex courses on StarseedFX. If you enjoy the content and want to support her work, consider joining The StarseedFX Community, where you will get daily market insights and trading alerts.
Share This Articles
Recent Articles
The GBP/NZD Magic Trick: How Genetic Algorithms Can Transform Your Forex Strategy
The British Pound-New Zealand Dollar: Genetic Algorithms and the Hidden Forces Shaping Currency Pairs
Chande Momentum Oscillator Hack for AUD/JPY
The Forgotten Momentum Trick That’s Quietly Dominating AUD/JPY Why Most Traders Miss the Signal
Bearish Market Hack HFT Firms Hope You’ll Never Learn
The One Bearish Market Hack High Frequency Traders Don't Want You to Know The
