
Why the Inverse Head and Shoulders Pattern is Quietly Dominating the Ripple US Dollar Charts
The Ripple US Dollar Secret Hiding in Plain Sight
Let me ask you a question: Have you ever stared at the Ripple US Dollar (XRP/USD) chart so long you started to see shapes that weren’t there? Maybe a dinosaur? Or your ex texting back? (Spoiler: neither ends well.) But what if I told you there is a pattern that appears more often than you’d expect—and it’s making quiet waves in the XRP market.
That pattern is the Inverse Head and Shoulders, and if you’re not already whispering sweet nothings to it during your analysis sessions, you’re leaving serious pips on the table.
The Forgotten Pattern That Outmaneuvered the Bears
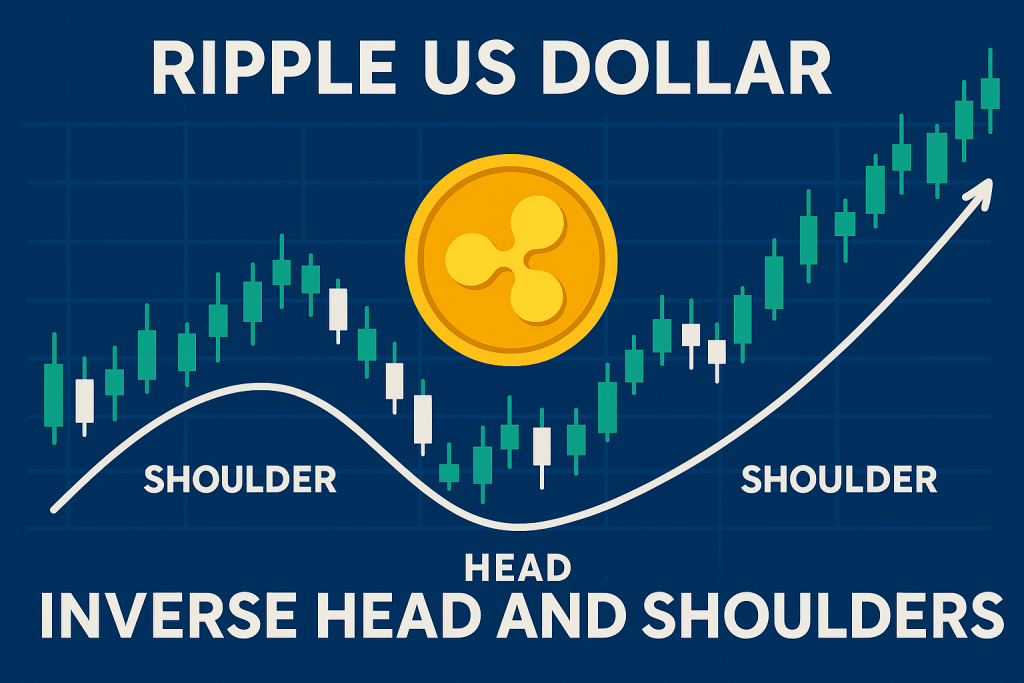
The Inverse Head and Shoulders (IHS) is like the Clark Kent of chart patterns: it may look ordinary, but it hides superpowers. This reversal setup signals a transition from a downtrend to an uptrend. And in the case of Ripple US Dollar, it’s been showing up in stealth mode during key retracement periods.
Let’s break it down ninja-style:
- Left Shoulder: Price drops, then rebounds.
- Head: Price drops lower than the first dip, then rebounds.
- Right Shoulder: Price drops again, but not as low as the head.
- Neckline Breakout: That satisfying breakout that makes you feel like a trading genius (or a magician).
What makes this interesting on the XRP/USD chart is the frequency and accuracy with which the IHS leads to breakout rallies. According to a recent study by The Technical Analyst, IHS patterns on major crypto pairs (including Ripple) produced an average ROI of 13.7% post-breakout with proper entry-exit alignment.
Real Case Study: The XRP/USD 2024 Spring Surge
Remember that beautiful XRP/USD rally in March 2024? Most traders were still busy tweeting moon memes. Meanwhile, the IHS pattern had already tipped off savvy traders two weeks prior.
Here’s how it played out:
- Left Shoulder: Formed in late Jan 2024, around $0.47.
- Head: Mid-Feb 2024, drop to $0.42.
- Right Shoulder: Late Feb bounce at $0.46.
- Neckline breakout: Boom! Early March, breakout above $0.50. Within 10 days, XRP surged to $0.58.
That’s a clean 17% gain.
While everyone was busy yelling “HODL,” traders using advanced pattern recognition were stacking gains like pancakes on a Sunday morning.
Why Most Traders Miss It (And How You Can Spot It Every Time)
Most traders miss the IHS on Ripple because:
- They’re glued to hype rather than structure.
- They’re looking for breakouts, not pre-breakouts.
- They think patterns are old-school. (Spoiler: That mindset is the true dinosaur.)
Here’s how to spot the IHS before it becomes obvious:
- Use volume divergence. If volume drops during the right shoulder and spikes at the neckline breakout, it’s legit.
- Apply the Smart Trading Tool from StarseedFX. It detects shoulder symmetry and neckline aggression better than your average human eyeball.
- Check confluence with RSI. If the RSI forms a higher low during the right shoulder, confirmation gets extra spicy.
Expert Insight: Why This Pattern Has Legs in the Ripple Market
According to Linda Raschke, a market wizard featured in New Market Wizards by Jack Schwager:
“The best trades come from structure first, and confirmation second.”
This sums up the entire IHS trade setup. You’re not guessing—you’re reading market psychology in HD.
Tom Bulkowski, author of Encyclopedia of Chart Patterns, ranks IHS among the top 5 most reliable reversal patterns, with a breakout success rate of over 80%.
Now let’s be real: there are no guarantees in trading. But if you’re skipping over high-probability structures in favor of TikTok hype, you might be out here bringing a rubber spoon to a sword fight.
Hidden Algorithmic Activity: Why Institutions Love This Setup
Here’s the part they don’t teach in free YouTube courses: Inverse Head and Shoulders patterns attract institutional bots like moths to a Fibonacci flame.
Why?
- Predictable breakout zones
- Low-risk stop placement (just below the head)
- Volume confirmation = execution trigger
Many HFT (high-frequency trading) systems are programmed to front-run this pattern when it aligns with momentum metrics. So while retail traders are waiting for a tweet, algos are entering at the neckline, riding the first wave.
Contrarian View: Sometimes the Pattern Fails (And That’s a Good Thing)
Not every IHS leads to a moon mission. Sometimes, they fake out.
But failure = data.
When an IHS fails, it usually means one of two things:
- Macro news trumps structure (e.g., SEC regulations on crypto).
- Volume confirmation is missing.
If volume at the neckline breakout is limp, it’s probably a trap. That’s why it’s essential to have a risk-adjusted entry plan. Use a tight stop under the head and let the market prove you right. Or wrong.
Step-by-Step: Trading the Inverse Head and Shoulders on XRP/USD
- Identify the Pattern: Use 4H or Daily chart to spot left shoulder, head, and right shoulder.
- Draw the Neckline: Connect the swing highs between shoulders and head.
- Wait for Breakout: Don’t jump the gun. Candle close above the neckline confirms the move.
- Confirm with Volume: Spike in volume = go time.
- Set Entry and Stop:
- Entry: 1-2 pips above neckline breakout
- Stop: Just below the head
- Target: Measure distance from head to neckline, then project it upward.
Bonus Tip: Stack confirmation with Fibonacci extensions and RSI divergence.
Tactical Bullet Points: What You Should Walk Away With
- The Inverse Head and Shoulders is a reliable reversal pattern that works surprisingly well on Ripple US Dollar (XRP/USD).
- Use volume and RSI divergence as confirmation tools.
- Recognize institutional order flow often piggybacks on this structure.
- The pattern can fail—and when it does, it’s still valuable for risk mapping.
- Advanced tools like the StarseedFX Smart Trading Tool can identify the pattern faster than traditional indicators.
Want to Go Deeper? Join the Inner Circle
Ready to catch more trades like this before they go viral on Twitter?
- Daily trade alerts, expert analysis, and elite strategies: Join the StarseedFX Community
- Master patterns like a pro with our Free Forex Courses
- Track trades with precision using the Free Trading Journal
—————–
Image Credits: Cover image at the top is AI-generated
PLEASE NOTE: This is not trading advice. It is educational content. Markets are influenced by numerous factors, and their reactions can vary each time.

Anne Durrell & Mo
About the Author
Anne Durrell (aka Anne Abouzeid), a former teacher, has a unique talent for transforming complex Forex concepts into something easy, accessible, and even fun. With a blend of humor and in-depth market insight, Anne makes learning about Forex both enlightening and entertaining. She began her trading journey alongside her husband, Mohamed Abouzeid, and they have now been trading full-time for over 12 years.
Anne loves writing and sharing her expertise. For those new to trading, she provides a variety of free forex courses on StarseedFX. If you enjoy the content and want to support her work, consider joining The StarseedFX Community, where you will get daily market insights and trading alerts.
Share This Articles
Recent Articles
The GBP/NZD Magic Trick: How Genetic Algorithms Can Transform Your Forex Strategy
The British Pound-New Zealand Dollar: Genetic Algorithms and the Hidden Forces Shaping Currency Pairs
Chande Momentum Oscillator Hack for AUD/JPY
The Forgotten Momentum Trick That’s Quietly Dominating AUD/JPY Why Most Traders Miss the Signal
Bearish Market Hack HFT Firms Hope You’ll Never Learn
The One Bearish Market Hack High Frequency Traders Don't Want You to Know The
