
The Diamond Bottom in Oil Prices: The Chart Pattern That Wears a Tuxedo and Doesn’t Flinch
Picture this: oil prices just crashed harder than your WiFi during NFP. You’re staring at a chart that looks like it partied too hard in both directions—and suddenly, something elegant forms. Not a head and shoulders. Not a triangle. No. It’s the diamond bottom. A rare, regal pattern that struts onto the chart like it owns the place—and if you know how to read it, it just might make you feel like you do too.
Let’s decode the myth, bust some oil-based misunderstandings, and uncover the hidden blueprint smart money uses when crude gets… well, crude.
“The Hidden Pattern That Shines When Oil Gets Slippery”
Here’s where it gets exciting. Most traders look at oil prices and panic when volatility spikes. But what if you could spot the bottom before the bounce—without playing guessing games or begging your indicators to behave?
Enter: the diamond bottom.
This isn’t just any pattern—it’s the chart equivalent of an escape room. Complex, deceptive, and exhilarating when cracked. Found most often after sharp downtrends (think of 2020 when oil briefly flirted with negative prices—yes, that actually happened), the diamond bottom hints at a stealthy reversal brewing behind the scenes.
“Patterns are the fingerprints of market psychology.” – John Murphy, Technical Analysis of the Financial Markets
“Why Most Traders Miss the Oil Rebound (And How to Catch It Like a Pro)”
Let’s talk about timing.
Most traders get greedy at the top and fearful at the bottom—like trying to jump on a trampoline only after it’s deflated. With oil prices, those emotions run high, especially when geopolitics, OPEC headlines, and inventory data create a storm wilder than a trader’s caffeine addiction.
So why do they miss the diamond bottom?
They expect instant gratification: Unlike a V-bottom, the diamond takes time—like a slow-cooked brisket or building a trading bot that doesn’t blow up your account.
They misidentify it: The diamond bottom often masquerades as chaos. You need structure recognition tools—or, at the very least, the patience of a monk during FOMC week.
They ignore volume: Rising volume during the breakout is the diamond’s way of saying, “I’m not just pretty—I’m powerful.”
“From Crack to Comeback: What Oil Prices and Diamond Bottoms Reveal About Market Memory”
Here’s the kicker: oil is emotional.
Not the cute, rom-com kind of emotional—but geopolitical soap opera meets hedge fund drama emotional. And when oil drops, it drops like your confidence after a bad scalp trade. But that’s exactly when the diamond bottom sneaks in.
Real-World Case Study:
In March 2020, crude oil plummeted to around $20/barrel, then staged a diamond bottom pattern over the next few months. By August, it was climbing back toward $40+. Traders who recognized the pattern pocketed gains faster than a high-frequency bot on espresso.
Underground Insight:
Diamond bottoms in oil often coincide with OPEC uncertainty or unexpected inventory reports. In fact, according to the U.S. Energy Information Administration (EIA), oil inventories have shown more predictive market response anomalies in the past 3 years than in the entire prior decade.
“Technical patterns become especially reliable in commodities when layered with supply shock narratives.” – Linda Raschke, Trading Legend
“How to Trade the Diamond Bottom in Oil: A Tactical Blueprint”
Let’s get ninja with it. Here’s your step-by-step oil-diamond strategy:
1. Identify the Downtrend
Look for a steep, news-driven drop in oil prices. Think macro events, OPEC drama, or wild inventory numbers.
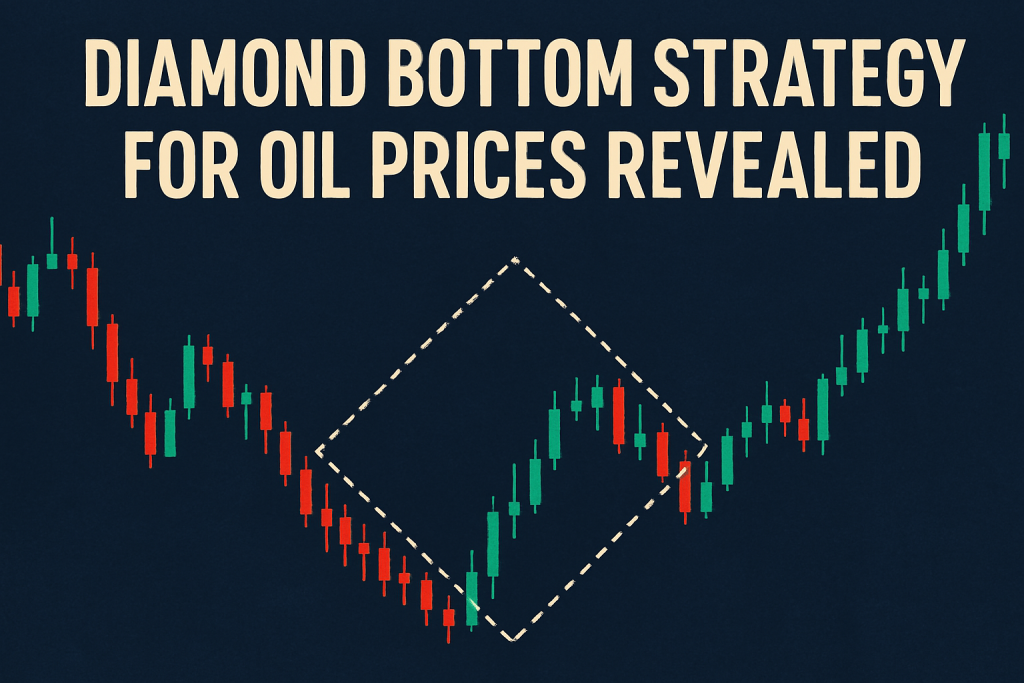
2. Recognize the Diamond Shape
Use trendlines to mark widening volatility (left side) that contracts into a tightening structure (right side). It should resemble a tilted square—yes, geometry meets finance.
3. Confirm With Volume
Volume should spike during the breakout. Quiet breakouts are suspect—like a silent alarm on a vault. Ignore them.
4. Set Entry on Breakout
Long entry just above the upper resistance line of the diamond. Use the daily chart for confirmation, not the 5-minute one your FOMO trades live on.
5. Stop-Loss Placement
Place your stop just below the last swing low inside the diamond. Give it room to breathe like a fine wine or a stubborn trend.
6. Take-Profit Strategy
Aim for a 1.5x to 2x reward-to-risk ratio. Bonus points if you scale out near the 50 or 200 EMA depending on trend context.
“The Overlooked Trick Hedge Funds Use with Oil and Patterns”
Most retail traders look at one chart and call it a day.
But hedge funds? They do multi-timeframe diamond confirmations, particularly on oil futures and CFDs, using volume profile and order flow overlays. If you haven’t yet tried this—you’re flying blind with a fancy compass.
What they do:
Spot the diamond bottom on the 4-hour chart.
Confirm institutional order clusters using volume profile on the 30-minute.
Place limit orders at supply-demand pivot zones.
Pro Tip: Combine this setup with commitment of traders (COT) report positioning. It’s like adding GPS to your trading car.
“Contrarian Insight: The Diamond Bottom That Faked a Reversal”
Here’s the honest truth—diamond bottoms aren’t bulletproof.
In late 2021, oil showed a textbook diamond bottom pattern around $62… only to collapse back down as global demand fears crushed sentiment.
Why? Because context is king. A perfect pattern in a broken macro landscape is like trying to grill steak during a hurricane. So here’s the rule: Never trust the pattern—trust the context + pattern + volume.
“Hidden Tactics for Anticipating Oil Reversals Before the Crowd”
If you want to be early (but not wrong), use these little-known signals:
✅ Track refinery utilization rates (reported by EIA weekly)
✅ Watch tanker traffic via satellite tracking (fun fact: some hedge funds literally do this)
✅ Use RSI divergence inside the diamond pattern for an early heads-up
✅ Monitor backwardation vs contango in oil futures—reversals often occur near rollovers
✅ Check correlation breakdowns with CAD, NOK, and energy sector ETFs
“Why This Strategy Works in 2025 (And Might Not in 2026)”
Right now, oil is deeply tied to supply chain reshuffles, geopolitical reconfiguration, and the green energy transition. That means volatility will stay high—and high volatility is the perfect petri dish for diamond bottom patterns.
But don’t get lazy.
If oil regulation shifts dramatically or liquidity in oil derivatives drops, patterns may morph, become unreliable, or move to other timeframes. Always adapt.
What You’ve Just Learned (And What Most Traders Still Don’t Know)
Diamond bottom patterns are rare but powerful reversal signals in oil prices
Volume, context, and multi-timeframe confirmation are your best friends
Retail traders often miss these setups because they misread the chaos
Hedge funds combine this pattern with order flow, COT data, and supply-demand models
There are warning signs and fakeouts—so stay sharp and don’t trade blind
Elite Tactics Recap:
Use volume confirmation and RSI divergence inside the pattern
Layer in macro oil news + technicals for high-conviction setups
Monitor tanker data, refinery reports, and futures rollovers
Avoid one-timeframe traps—use 4H + 30M volume overlays
Trade breakouts with calculated RRR, not emotion
???? Want to stay ahead of the curve and master patterns like the diamond bottom?
Explore our elite resources:
???? Latest Market News
???? Free Forex Courses
—————–
Image Credits: Cover image at the top is AI-generated
PLEASE NOTE: This is not trading advice. It is educational content. Markets are influenced by numerous factors, and their reactions can vary each time.

Anne Durrell & Mo
About the Author
Anne Durrell (aka Anne Abouzeid), a former teacher, has a unique talent for transforming complex Forex concepts into something easy, accessible, and even fun. With a blend of humor and in-depth market insight, Anne makes learning about Forex both enlightening and entertaining. She began her trading journey alongside her husband, Mohamed Abouzeid, and they have now been trading full-time for over 12 years.
Anne loves writing and sharing her expertise. For those new to trading, she provides a variety of free forex courses on StarseedFX. If you enjoy the content and want to support her work, consider joining The StarseedFX Community, where you will get daily market insights and trading alerts.
Share This Articles
Recent Articles
The GBP/NZD Magic Trick: How Genetic Algorithms Can Transform Your Forex Strategy
The British Pound-New Zealand Dollar: Genetic Algorithms and the Hidden Forces Shaping Currency Pairs
Chande Momentum Oscillator Hack for AUD/JPY
The Forgotten Momentum Trick That’s Quietly Dominating AUD/JPY Why Most Traders Miss the Signal
Bearish Market Hack HFT Firms Hope You’ll Never Learn
The One Bearish Market Hack High Frequency Traders Don't Want You to Know The
