
The Bullish Percent Index Meets Head & Shoulders: A Ninja Trader’s Guide to Market Reversals
Why Most Traders Miss the Plot Twist
Imagine watching a thriller where everyone ignores the obvious villain. That’s what it’s like watching traders overlook the Bullish Percent Index (BPI) while obsessing over basic patterns. It’s like bringing a butter knife to a ninja duel.
Here’s the kicker: when you combine the Bullish Percent Index with the Head and Shoulders pattern, you unlock a contrarian super-strategy so potent it might as well come with its own Netflix docuseries.
The Bullish Percent Index: Not Just for Nerds
Let’s demystify this unsung hero. The Bullish Percent Index is a breadth indicator showing the percentage of stocks (or currency pairs, if you’re a Forex samurai) in a group that are showing point-and-figure buy signals.
- Above 70% = overbought territory
- Below 30% = oversold territory
- Between 30%-70% = indecisive zone aka “the friend zone” of market signals
Think of it like your trading barometer. When BPI is high, euphoria runs wild. When it drops, panic sets in. But here’s where the magic happens: BPI isn’t just about what it shows—it’s about when you look.
“Markets are never wrong, but opinions often are.” — Jesse Livermore
Head and Shoulders: The Drama Queen of Chart Patterns
Ah yes, the good ol’ Head and Shoulders pattern. A familiar face in the charting soap opera.
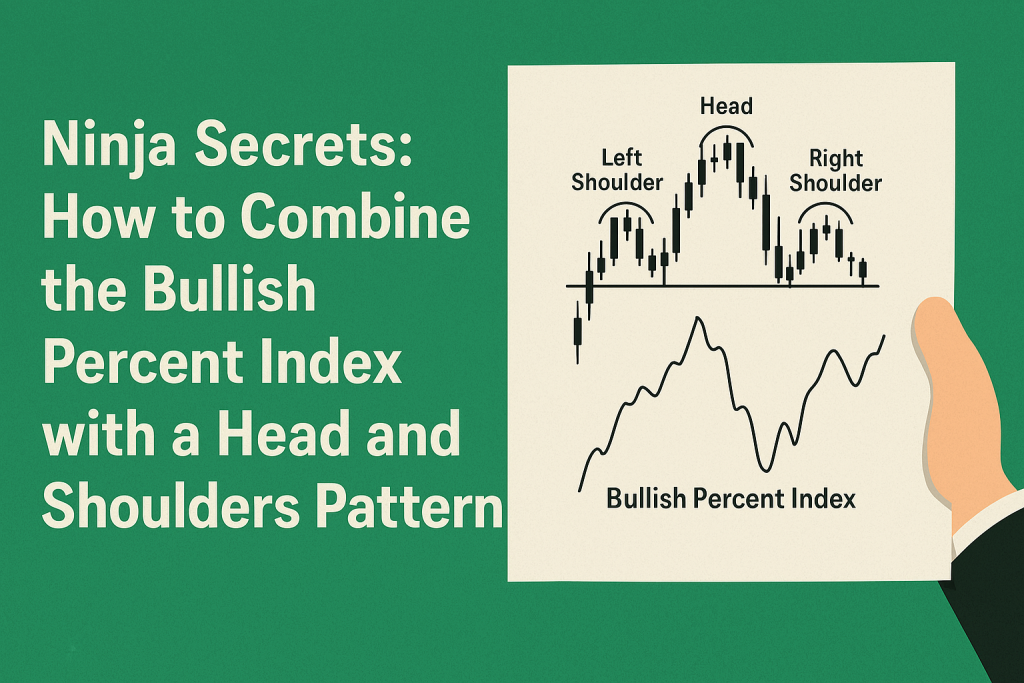
- Left Shoulder: Price rise then minor fall
- Head: Higher peak forms, followed by another decline
- Right Shoulder: Smaller rise that fails to beat the head
- Neckline: Connect the lows. A break here = game on.
Most traders react after the neckline breaks. That’s like showing up to a party after everyone already left.
The Hidden Combo: How to Marry BPI with Head and Shoulders
Ready for the fun part? Here’s how to combine BPI and Head & Shoulders to front-run reversals with ninja-like precision.
- Watch BPI Divergence
- If price forms a Head and Shoulders top, but BPI is not confirming the new highs, that’s your red flag.
- Classic sign: market is losing steam while retail traders are still partying.
- Time Entry with BPI Reversal
- BPI peaking around 70+ and starting to roll over? That’s your cue.
- Combine that with a right shoulder forming? Chef’s kiss.
- Neckline Break = Confirmation, Not Entry
- Enter earlier, near right shoulder, with tight stop.
- Wait for BPI to cross below 50% for added confidence.
- BPI as a Risk Filter
- No BPI divergence? Skip it.
- Treat BPI like your lie detector. If it’s telling a different story than price, believe it.
Why This Combo Outsmarts the Pros Let’s talk edge.
In a recent study by the Bank for International Settlements (BIS), it was noted that over 70% of retail Forex traders lose money due to delayed entries and poor confirmation tactics.
Meanwhile, institutional traders use multi-layer confirmation—breadth, sentiment, volume. Guess what BPI covers? Breadth and sentiment, wrapped in one beautiful package.
“It’s not about being right. It’s about being early with a parachute.” — Linda Bradford Raschke
Real-World Ninja Moment: EUR/USD in Early 2023
In early 2023, EUR/USD printed a textbook head and shoulders top. Retail traders shorted after the neckline broke. But those tracking BPI noticed a divergence a week before.
- BPI dropped from 72% to 58% while EUR/USD printed the “Head.”
- Smart money went short at the right shoulder.
- When the neckline cracked, they were already in profit.
Underground Tactics to Level Up
Want to go full ninja? Try these less-known tricks:
- Overlay BPI with Currency Strength Index
- Double confirmation. When both disagree with price, you’ve found gold.
- Use BPI for False Break Detection
- If price breaks neckline but BPI is climbing? Trap. Avoid it.
- Backtest BPI + H&S on Non-Major Pairs
- EUR/NZD, GBP/AUD, CAD/CHF. Most traders ignore these. You won’t.
Avoid the Rookie Mistake A common blunder: Using BPI in isolation or with lagging indicators like MACD.
Here’s the truth: BPI shines brightest before the market does. Pair it with Head and Shoulders, and it becomes your trading flashlight in a dark cave.
Your New Ritual: The Precision Checklist
- Spot Potential H&S forming on your pair
- Overlay BPI – is it diverging?
- Look for a BPI rollover above 70 or rise below 30
- Time entry near right shoulder if confirmation aligns
- Set tight stop-loss near the head
- Ride the neckline break with confidence
Tactical Recap: Game-Changing Takeaways
- Use BPI to detect market sentiment before price confirms
- Head and Shoulders + BPI = early, smart entries
- Monitor for divergences to spot traps
- Use BPI like a compass in volatile times
- Trade with tighter stops, smarter targets, and more confidence
Want to Level Up? Here’s Your Path
- Stay updated with Forex News & Economic Indicators
- Master the strategy with our Free Forex Courses
- Join our Community of Traders and get live alerts and expert breakdowns
- Set up a Free Trading Plan to prepare your next move
- Track every trade with a Free Trading Journal like a pro
- Sharpen your edge with our Smart Trading Tool
—————–
Image Credits: Cover image at the top is AI-generated
PLEASE NOTE: This is not trading advice. It is educational content. Markets are influenced by numerous factors, and their reactions can vary each time.

Anne Durrell & Mo
About the Author
Anne Durrell (aka Anne Abouzeid), a former teacher, has a unique talent for transforming complex Forex concepts into something easy, accessible, and even fun. With a blend of humor and in-depth market insight, Anne makes learning about Forex both enlightening and entertaining. She began her trading journey alongside her husband, Mohamed Abouzeid, and they have now been trading full-time for over 12 years.
Anne loves writing and sharing her expertise. For those new to trading, she provides a variety of free forex courses on StarseedFX. If you enjoy the content and want to support her work, consider joining The StarseedFX Community, where you will get daily market insights and trading alerts.
Share This Articles
Recent Articles
The GBP/NZD Magic Trick: How Genetic Algorithms Can Transform Your Forex Strategy
The British Pound-New Zealand Dollar: Genetic Algorithms and the Hidden Forces Shaping Currency Pairs
Chande Momentum Oscillator Hack for AUD/JPY
The Forgotten Momentum Trick That’s Quietly Dominating AUD/JPY Why Most Traders Miss the Signal
Bearish Market Hack HFT Firms Hope You’ll Never Learn
The One Bearish Market Hack High Frequency Traders Don't Want You to Know The
