
Australian Dollar vs. Canadian Dollar: The Double-Top Pattern That Could Change Your Trading Game
The Hidden Trading Setup That Separates the Pros from the Amateurs
Some trading setups scream “obvious,” like buying Bitcoin at $69,000 because “it’s going to the moon!” But then there are setups that whisper, waiting for only the sharpest traders to catch them before the market flips. One such hidden gem? The double top pattern on the Australian Dollar vs. Canadian Dollar (AUD/CAD) pair.
Most traders recognize a double top, but very few understand how to exploit it with precision. If you’ve ever watched a promising setup collapse faster than a bad first date, you’re not alone. But don’t worry—I’ll show you how to spot, confirm, and profit from a double-top pattern before the rest of the herd catches on.
Why Most Traders Get It Wrong (And How You Can Avoid It)
The double top is a bearish reversal pattern that signals an impending drop. Sounds simple, right? Wrong. Most traders make three fatal mistakes:
- Entering too early – Just because price touches a resistance level twice doesn’t mean it’s a double top.
- Ignoring confirmation – A true double top only forms when the neckline is broken, not before.
- Placing stops too tight – If your stop-loss is hugging price action like a needy ex, you’ll get stopped out before the real move happens.
Let’s get deeper into the strategy and how you can exploit this pattern like a pro.
The Secret Formula: How to Trade the AUD/CAD Double Top Like a Pro
1. Spot the Pattern Before the Masses
A double top forms when price reaches a high, pulls back, then retests that high again—only to fail and reverse. Here’s the game plan:
- Look for two peaks at roughly the same level.
- Price must form a valley in between (this is the neckline).
- Volume should be lower on the second peak—a hidden clue that buyers are running out of steam.
- Wait for price to break below the neckline before considering an entry.
Real-World Example: AUD/CAD in Action
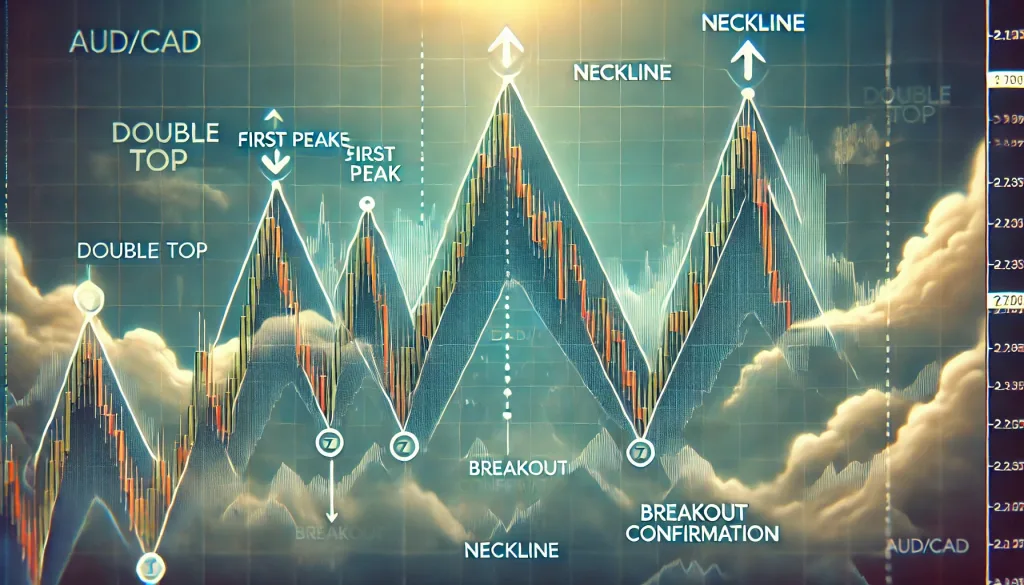
In 2024, the AUD/CAD formed a textbook double top around 0.9050, teasing traders into thinking it was still bullish. Smart traders noticed the second peak had weak momentum, signaling a lack of buying pressure. Once the neckline broke at 0.8920, the floodgates opened, and price sank over 100 pips.
2. The Ninja Tactic: Wait for the Retest
Here’s the mistake most traders make: They jump in too early.
A disciplined trader waits for price to break the neckline, then retest it from below before shorting. This gives you:
- Better entry with a tighter stop-loss
- Confirmation that sellers are in control
- Avoidance of false breakouts
Entry Criteria:
- Enter only after a confirmed retest of the neckline.
- Stop-loss above the second peak (to avoid getting faked out).
- Target at least 2x the risk, usually based on the height of the pattern.
Example Trade Setup (AUD/CAD 2024 Double Top)
- Entry: 0.8920 (after the retest)
- Stop-loss: 0.9020 (above the second peak)
- Take profit: 0.8800 (height of the pattern projected downward)
Outcome? A solid 120-pip profit while others got chopped up by false breakouts.
3. Advanced Trick: Use RSI Divergence for Confirmation
Want an extra edge? Check Relative Strength Index (RSI) for divergence.
- If price forms a second peak but RSI forms a lower high, it’s a clear signal that bullish momentum is fading.
- This is the sniper’s confirmation, ensuring you’re not shorting into a trap.
4. Watch Out for These Hidden Traps
Even when you know what you’re doing, there are still traps. Here’s what to watch out for:
Fakeouts
- If price barely breaks the neckline and reverses, it’s a bull trap designed to shake out retail traders.
- Solution? Wait for the retest before pulling the trigger.
News Events
- AUD/CAD is sensitive to commodity prices and interest rate differentials.
- If a major economic event is coming (like an RBA or BoC rate decision), wait for post-news confirmation before entering.
Conclusion: Turn Market Mistakes Into Profitable Setups
Most traders fail to trade the double top effectively because they lack patience and precision. But now, you’ve got a blueprint for success:
✅ Spot the pattern early (two peaks, weak momentum, neckline formation)
✅ Wait for confirmation (break and retest of the neckline)
✅ Use RSI divergence for added confidence
✅ Avoid fakeouts by waiting for the right entry
Master these tactics, and you’ll sidestep common traps while capitalizing on one of the most reliable reversal patterns in Forex trading.
Want to go deeper? Get daily trade alerts and advanced analysis from the pros at StarseedFX. Your next winning trade might just be waiting for you!
—————–
Image Credits: Cover image at the top is AI-generated
PLEASE NOTE: This is not trading advice. It is educational content. Markets are influenced by numerous factors, and their reactions can vary each time.

Anne Durrell & Mo
About the Author
Anne Durrell (aka Anne Abouzeid), a former teacher, has a unique talent for transforming complex Forex concepts into something easy, accessible, and even fun. With a blend of humor and in-depth market insight, Anne makes learning about Forex both enlightening and entertaining. She began her trading journey alongside her husband, Mohamed Abouzeid, and they have now been trading full-time for over 12 years.
Anne loves writing and sharing her expertise. For those new to trading, she provides a variety of free forex courses on StarseedFX. If you enjoy the content and want to support her work, consider joining The StarseedFX Community, where you will get daily market insights and trading alerts.
Share This Articles
Recent Articles
The GBP/NZD Magic Trick: How Genetic Algorithms Can Transform Your Forex Strategy
The British Pound-New Zealand Dollar: Genetic Algorithms and the Hidden Forces Shaping Currency Pairs
Chande Momentum Oscillator Hack for AUD/JPY
The Forgotten Momentum Trick That’s Quietly Dominating AUD/JPY Why Most Traders Miss the Signal
Bearish Market Hack HFT Firms Hope You’ll Never Learn
The One Bearish Market Hack High Frequency Traders Don't Want You to Know The
