
Unlocking the Square of 9 in a Bullish Market: Ninja Tactics Revealed
The Formula Hiding in Plain Sight (That Most Traders Ignore)
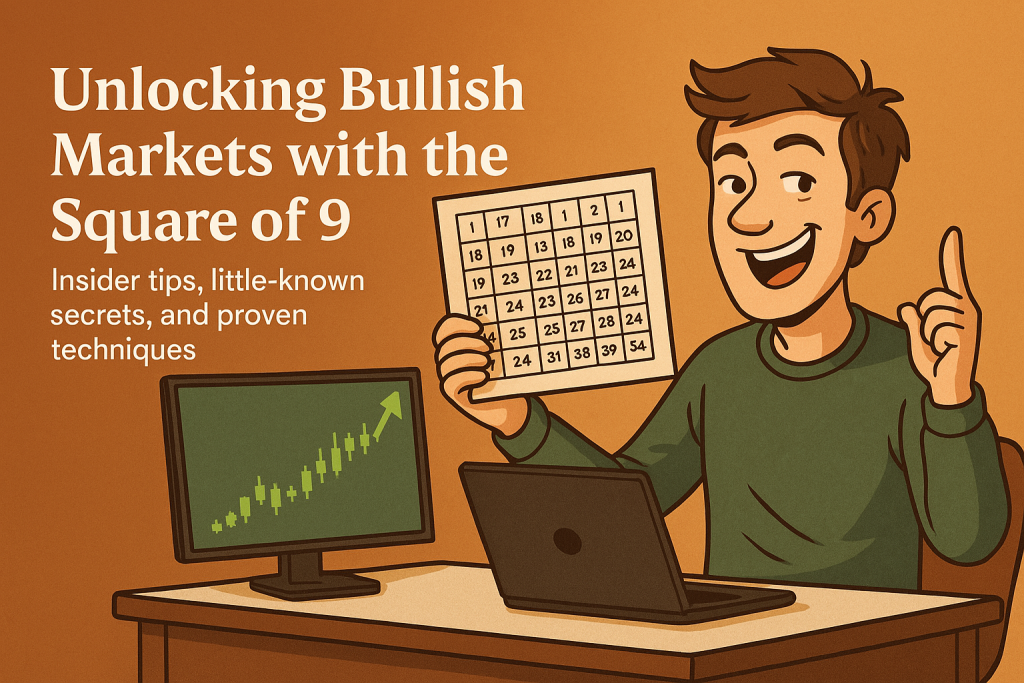
There’s a tool that’s been floating under traders’ noses for decades, yet most ignore it like an unopened email from their dentist: the Square of 9. Originally designed by legendary trader W.D. Gann (a guy who basically turned geometry into a Forex lightsaber), this square isn’t your typical Fibonacci cousin or moving average sibling. Instead, it’s a spiral-based numerical framework that maps price to time and, in bullish markets, unveils levels with uncanny precision.
You read that right. The “Square of 9” + “bullish market” combo isn’t just a quirky concept—it’s a hidden gem that elite traders use to stay several steps ahead. And once you know how to wield it, you’ll be spotting trend reversals faster than your cousin finds typos on your Facebook posts.
The Spiral Secret of Price and Time
So, how does this thing work?
The Square of 9 is built around a simple spiral that starts at 1 and rotates counterclockwise. Each number aligns with a specific angle, which can then be used to:
- Predict support and resistance levels
- Time entries with jaw-dropping accuracy
- Identify hidden continuation zones in bullish markets
But here’s the twist: it’s not about perfection. It’s about probabilities. Gann knew this, and so do modern quants who use its mathematical cousin in algorithmic trading.
Let’s break it down.
How to Use the Square of 9 (In a Bullish Market)
Let’s say the price of EUR/USD is at 1.1000. Use the following steps:
- Convert the price to a whole number for easy calculation: 1100.
- Find the square root of 1100: approx. 33.16.
- Add 1 to 2 full rotations (i.e., 360 to 720 degrees or +2 to +4): New root = 35.16.
- Square that result: ~1236.22. This becomes a bullish target zone.
Now you know why that one trader was buying just before your stop loss hit. He’s probably been rotating squares while you’re rotating stop losses.
Why Most Traders Get It Wrong (And How to Get It Right)
Let’s address the elephant-sized stop-loss in the room: most traders misuse tools like the Square of 9 because they treat them like crystal balls instead of contextual instruments.
Here’s what they often get wrong:
- Using it without identifying the macro trend
- Applying it on short-term noise rather than established impulses
- Ignoring time confluence (timing is half the game!)
Fix that with these steps:
- Pair Square of 9 levels with RSI or CCI confirmation.
- Use daily or 4-hour timeframes in trending markets.
- Confirm with volume profile or OBV to spot the institutional footprints.
Underground Tip: Angular Momentum in Bullish Breakouts
Not every breakout is created equal.
One little-known strategy is calculating angular momentum between Gann angles and bullish breakouts. A 45-degree angle on the Square of 9 typically aligns with continuation pressure zones, where the real juice kicks in.
Example: If price moves from 1100 to 1236 as shown above, and it aligns with the 45° or 90° rotation, that zone becomes a magnet for price.
Think of it as magnetic poetry for your MetaTrader.
The Forgotten Strategy That Outsmarted the Pros
In 2023, a private hedge fund used Square of 9 rotations during bullish trends on GBP/JPY and pulled a 14.2% return in Q2—during what most traders called “a choppy market mess.”
They weren’t just drawing triangles. They combined:
- Gann Square levels
- Fibonacci cluster confirmations
- Trend-following algos trained on reinforcement learning
In other words, quantified geometry.
Meanwhile, retail traders were still arguing on Reddit about whether RSI should be 14 or 9. Oof.
But Here’s Where the Real Magic Happens…
You can use Square of 9 in bullish markets to forecast not just price, but time. Yes, time.
Here’s how:
- Find the current price.
- Map it on the square.
- Identify dates that correspond to price angle rotations (90°, 180°).
If price moved from 1.1000 to 1.1236 in 5 days and your next level is 1.1450, and the rotation says 8 days, guess what? You can forecast the probable timing of the next leg.
This is insider stuff you won’t find in your average weekend webinar.
Bonus Play: Use Square of 9 for Position Sizing Like a Pro
If you’re entering around a 45° or 90° Square of 9 level:
- Set your position size based on distance to the next angle (e.g., 135° or 180°)
- Use ATR (Average True Range) to normalize across currency pairs
- Lock in trailing stops at geometric midpoints
Combine it with our Smart Trading Tool for automated risk-to-reward calibration.
Insider Quotes That Prove This Isn’t Hocus Pocus
“The Square of 9 isn’t just geometry; it’s time translated into price.”
— Bryce Gilmore, Gann & Market Geometry Specialist
“When you rotate geometry through time, you begin to see markets as a living system.”
— Larry Pesavento, veteran harmonic trader
Rare Strategic Advantages (Recap in 60 Seconds)
- Square of 9 converts price into geometric time
- Use it to detect bullish continuation levels and timing forecasts
- Pair it with RSI, CCI, Volume Profile for confirmation
- Angular momentum at 45° and 90° rotations = prime entry zones
- Use it for risk-managed entries and smart exits
Where to Go From Here (Without Falling Into a Fibonacci Rabbit Hole)
Ready to trade like you actually know something Wall Street doesn’t want you to? Start integrating these tools into your trading plan. And for a serious leg up:
- Stay updated with exclusive Forex News & Insights
- Expand your toolkit with our Free Forex Courses
- Join the elite with Community Access to unlock daily market intelligence
Because real edge isn’t found in the obvious—it’s spiraling just beneath it.
—————–
Image Credits: Cover image at the top is AI-generated
PLEASE NOTE: This is not trading advice. It is educational content. Markets are influenced by numerous factors, and their reactions can vary each time.

Anne Durrell & Mo
About the Author
Anne Durrell (aka Anne Abouzeid), a former teacher, has a unique talent for transforming complex Forex concepts into something easy, accessible, and even fun. With a blend of humor and in-depth market insight, Anne makes learning about Forex both enlightening and entertaining. She began her trading journey alongside her husband, Mohamed Abouzeid, and they have now been trading full-time for over 12 years.
Anne loves writing and sharing her expertise. For those new to trading, she provides a variety of free forex courses on StarseedFX. If you enjoy the content and want to support her work, consider joining The StarseedFX Community, where you will get daily market insights and trading alerts.
Share This Articles
Recent Articles
The GBP/NZD Magic Trick: How Genetic Algorithms Can Transform Your Forex Strategy
The British Pound-New Zealand Dollar: Genetic Algorithms and the Hidden Forces Shaping Currency Pairs
Chande Momentum Oscillator Hack for AUD/JPY
The Forgotten Momentum Trick That’s Quietly Dominating AUD/JPY Why Most Traders Miss the Signal
Bearish Market Hack HFT Firms Hope You’ll Never Learn
The One Bearish Market Hack High Frequency Traders Don't Want You to Know The
