
Master RSI and Bearish Pennants for Forex Success
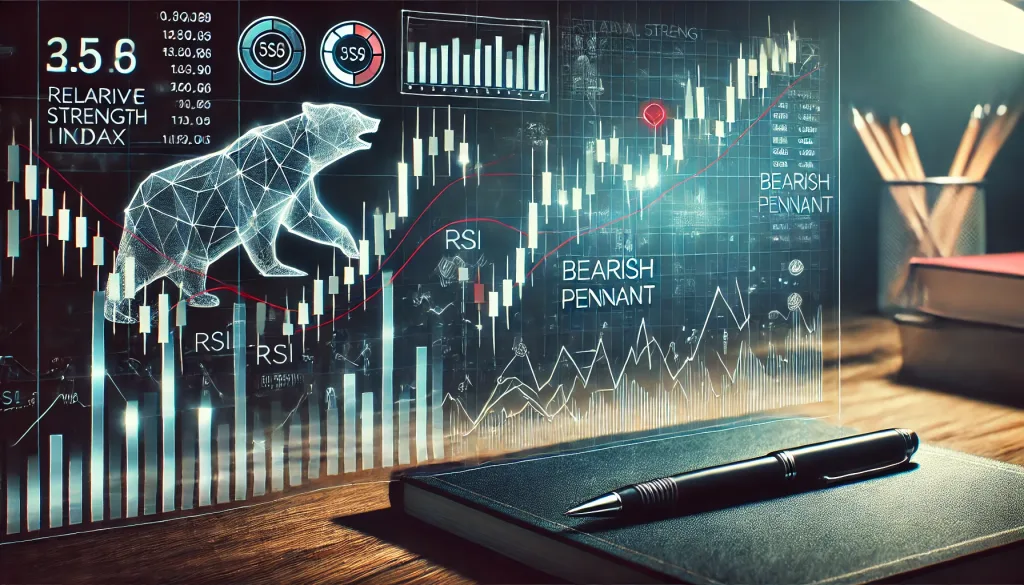
Cracking the Code: Mastering RSI and Bearish Pennants in Forex
Trading Forex is like trying to tame a dragon—it’s exciting, unpredictable, and occasionally singes your ego. Among the many tools in a trader’s arsenal, the Relative Strength Index (RSI) and Bearish Pennants stand out as powerful allies. When used together, these two can help you decipher market trends and spot game-changing opportunities. Let’s dive into how you can leverage these tools to conquer the Forex battlefield.
Why RSI and Bearish Pennants Deserve Your Attention
The RSI is like a mood ring for the market, telling you whether a currency pair is overbought or oversold. On the other hand, the Bearish Pennant is a continuation pattern that signals a potential downtrend after a brief consolidation. Together, they’re like peanut butter and jelly—better when combined.
For traders, these tools can provide:
- Precise entry and exit points
- Confirmation of market trends
- Advanced warning signals for reversals
Breaking Down RSI: The Market’s Emotional Barometer
The RSI is a momentum oscillator that measures the speed and change of price movements. It oscillates between 0 and 100 and is typically considered overbought above 70 and oversold below 30. Think of it as a lie detector test for market enthusiasm.
How to Use RSI Effectively:
- Spot Overbought and Oversold Conditions:
- If RSI is above 70, the market might be overbought—time to consider selling.
- If RSI is below 30, the market might be oversold—a buying opportunity.
- Identify Divergences:
- Bullish divergence: RSI rises while the price falls.
- Bearish divergence: RSI falls while the price rises.
- Combine with Other Indicators:
- Pair RSI with moving averages or Bollinger Bands for better accuracy.
The Bearish Pennant: A Trader’s Secret Weapon
The Bearish Pennant forms when a currency pair experiences a sharp drop (the flagpole) followed by a period of consolidation (the pennant). It’s like the market taking a breather before continuing its downward sprint.
How to Spot a Bearish Pennant:
- Look for the Flagpole:
- A steep, sharp decline sets the stage.
- Identify the Pennant Shape:
- A small symmetrical triangle forms as the market consolidates.
- Breakout Confirmation:
- Wait for the price to break below the pennant’s lower trendline to confirm the pattern.
Combining RSI and Bearish Pennants: The Ultimate Power Move
When RSI and Bearish Pennants align, it’s like finding a pot of gold at the end of a rainbow. Here’s how to use them together:
Step-by-Step Strategy:
- Identify the Bearish Pennant:
- Spot the flagpole and pennant shape.
- Check RSI Levels:
- Ensure RSI is either neutral or showing a bearish divergence.
- Wait for the Breakout:
- Confirm the breakout from the pennant’s lower trendline.
- Place Your Trade:
- Enter a short position after the breakout.
- Set a stop-loss above the pennant’s upper trendline.
- Monitor RSI:
- Use RSI to gauge when the market might reverse or hit oversold conditions.
Real-World Example: RSI and Bearish Pennant in Action
Let’s say you’re trading the EUR/USD pair. The price forms a Bearish Pennant after a sharp drop. Simultaneously, RSI shows a bearish divergence, confirming a potential downtrend. Once the price breaks below the pennant’s lower trendline, you enter a short position and ride the wave downward. Cha-ching!
Common Pitfalls to Avoid
- Ignoring False Breakouts:
- Not every breakout is legit. Always wait for confirmation.
- Over-relying on One Indicator:
- Use RSI and Bearish Pennants as part of a broader strategy.
- Skipping Risk Management:
- Always use stop-loss orders to protect your capital.
Advanced Tips for Mastering RSI and Bearish Pennants
- Backtest Your Strategy:
- Use historical data to see how well your strategy performs.
- Incorporate Volume Analysis:
- Rising volume during a breakout adds credibility to the pattern.
- Stay Updated:
- Keep an eye on economic news and events that might impact currency pairs.
Trading with RSI and Bearish Pennants isn’t just about following rules; it’s about understanding the psychology of the market. By combining these tools, you can uncover hidden opportunities and make more informed trading decisions. Remember, the key to success lies in practice, patience, and staying curious. Happy trading!
—————–
Image Credits: Cover image at the top is AI-generated
PLEASE NOTE: This is not trading advice. It is educational content. Markets are influenced by numerous factors, and their reactions can vary each time.

Anne Durrell & Mo
About the Author
Anne Durrell (aka Anne Abouzeid), a former teacher, has a unique talent for transforming complex Forex concepts into something easy, accessible, and even fun. With a blend of humor and in-depth market insight, Anne makes learning about Forex both enlightening and entertaining. She began her trading journey alongside her husband, Mohamed Abouzeid, and they have now been trading full-time for over 12 years.
Anne loves writing and sharing her expertise. For those new to trading, she provides a variety of free forex courses on StarseedFX. If you enjoy the content and want to support her work, consider joining The StarseedFX Community, where you will get daily market insights and trading alerts.
Share This Articles
Recent Articles
The GBP/NZD Magic Trick: How Genetic Algorithms Can Transform Your Forex Strategy
The British Pound-New Zealand Dollar: Genetic Algorithms and the Hidden Forces Shaping Currency Pairs
Chande Momentum Oscillator Hack for AUD/JPY
The Forgotten Momentum Trick That’s Quietly Dominating AUD/JPY Why Most Traders Miss the Signal
Bearish Market Hack HFT Firms Hope You’ll Never Learn
The One Bearish Market Hack High Frequency Traders Don't Want You to Know The
