
Oil Prices and the Ascending Triangle: The Hidden Setup That Caught the Smart Money Off Guard
The Setup That Made a Trader Spit Out His Coffee
Picture this: It’s 9:32 AM. A seasoned trader, let’s call him Mike, leans back with his double espresso, watching oil prices flirt with a key resistance level. Then it happens—a textbook ascending triangle forms. Within minutes, prices break out upwards. Mike, unprepared, spits coffee all over his keyboard. Another day, another lesson from the market gods.
Don’t be Mike.
Understanding the link between oil prices and an ascending triangle pattern can mean the difference between a coffee-covered disaster and a champagne-popping win.
Why Oil Prices Make or Break Traders
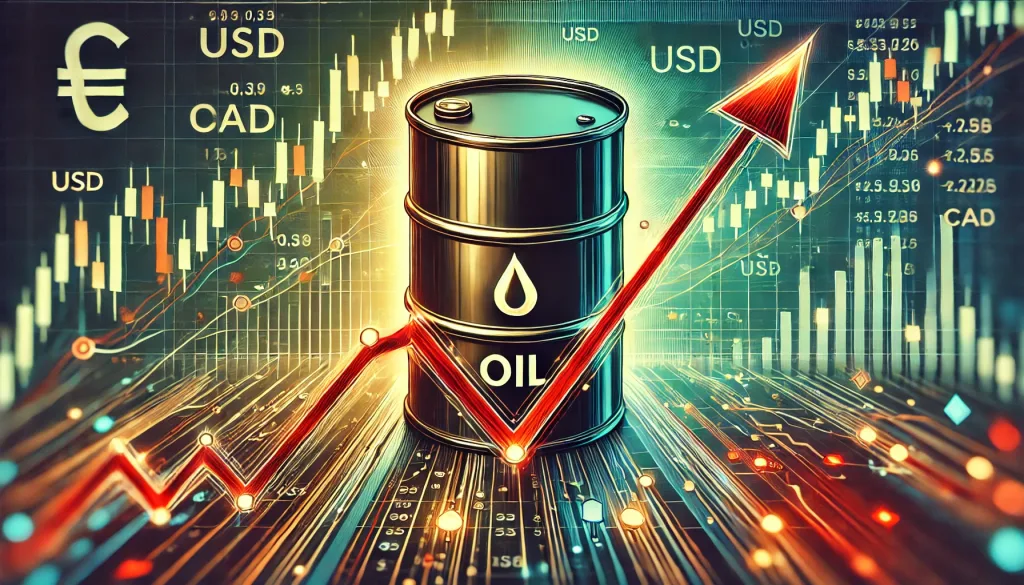
Crude oil isn’t just that black stuff powering your car. It’s the heartbeat of global markets. Fluctuations in oil prices ripple through currencies like the CAD and NOK, making oil a silent puppet master in Forex trading.
According to the U.S. Energy Information Administration, oil prices surged by over 25% in 2023 due to supply cuts and geopolitical tensions. If you didn’t see that coming, you probably missed the chart pattern that whispered it: the ascending triangle.
The Ascending Triangle: The Wall Street Sneak Attack
The ascending triangle is like that friend who always shows up late but brings amazing snacks—frustrating, but worth it. It signals a potential breakout, usually upward. Picture higher lows squeezing against a stubborn resistance level. Buyers keep knocking, and eventually, the door busts open.
What They Won’t Tell You About the Ascending Triangle
Most textbooks stop at “watch for the breakout,” but pros like Kathy Lien, Managing Director at BK Asset Management, warn that the pre-breakout phase often tricks newbies:
“False breakouts are common; the key is volume confirmation and understanding the fundamental drivers,” she advises (Source: CNBC).
Translation: If oil supply cuts are in the headlines and your triangle looks like a rocket about to launch, don’t hesitate.
How Oil Prices Amplify the Ascending Triangle’s Power
Here’s where we level up. When oil prices consolidate near resistance while forming an ascending triangle, it often foreshadows supply disruptions or demand surges. The breakout can be explosive.
Case Study: In October 2023, Brent Crude formed a textbook ascending triangle. Analysts on Bloomberg predicted a potential breakout due to OPEC production cuts. When the breakout came, prices surged 8% in two weeks, pushing USD/CAD down like a rock.
The Ninja Tactics Pros Use That You Won’t Find on YouTube
- Oil-Informed Confirmation: Before entering on a triangle breakout, check crude oil inventory reports and geopolitical news.
- CAD as a Proxy: If oil is breaking out, CAD pairs often follow. USD/CAD, EUR/CAD, and GBP/CAD become prime hunting grounds.
- Breakout Buffer Entry: Instead of jumping in the second resistance breaks, wait for a retest. Pros enter when prices kiss the breakout level goodbye.
How the Smart Money Catches You Sleeping
Institutions watch ascending triangles on oil prices like hawks. When retail traders rush in on the breakout, big players push prices back below resistance to trigger stop losses before the real rally. It’s called a stop hunt, and it’s the financial version of stealing candy from a baby.
How to Outsmart the Institutions
- Split Entry Technique: Enter 50% on breakout, 50% on retest.
- Deep Pocket Confirmation: Look for institutional volume surges during the breakout. Tools like the Smart Trading Tool by StarseedFX can help monitor order flow.
- Avoid the Obvious: If everyone on Twitter is screaming “BREAKOUT,” consider waiting for a fake-out dip before entering.
The Hidden Correlation: Oil Prices and the USD/CAD Whip Move
A lesser-known trick: When oil prices break out of an ascending triangle, USD/CAD often makes a delayed counter move. If oil spikes, USD/CAD usually drops a few hours later. Catching this lag can be a goldmine.
Example: On June 12, 2023, oil spiked 3% after Saudi supply news. USD/CAD took a leisurely 6-hour nap before plunging 90 pips.
When the Triangle Fails (And Saves You from Disaster)
Failure isn’t always bad. A triangle that breaks downward amid bullish oil news is a red flag. This divergence often signals broader risk aversion, like a looming recession. Pros see it as an early exit cue.
Elite Tactics Recap (Because Memory Is Overrated)
- Oil-Informed Confirmation: Align ascending triangle setups with oil news.
- CAD Proxy Play: Track USD/CAD and CAD pairs for parallel moves.
- Split Entry Technique: Avoid stop hunts by entering partially on breakout and retest.
- Institutional Volume Check: Validate breakouts with volume.
- Delayed USD/CAD Reaction: Trade the oil spike lag effect.
Next-Level Insights, Delivered Daily
Stay ahead with StarseedFX:
- Forex News Today: Exclusive market updates. starseedfx.com/forex-news-today
- Advanced Forex Courses: Hidden strategies revealed. starseedfx.com/free-forex-courses
- Community Membership: Live analysis, elite tactics. starseedfx.com/community
—————–
Image Credits: Cover image at the top is AI-generated
PLEASE NOTE: This is not trading advice. It is educational content. Markets are influenced by numerous factors, and their reactions can vary each time.

Anne Durrell & Mo
About the Author
Anne Durrell (aka Anne Abouzeid), a former teacher, has a unique talent for transforming complex Forex concepts into something easy, accessible, and even fun. With a blend of humor and in-depth market insight, Anne makes learning about Forex both enlightening and entertaining. She began her trading journey alongside her husband, Mohamed Abouzeid, and they have now been trading full-time for over 12 years.
Anne loves writing and sharing her expertise. For those new to trading, she provides a variety of free forex courses on StarseedFX. If you enjoy the content and want to support her work, consider joining The StarseedFX Community, where you will get daily market insights and trading alerts.
Share This Articles
Recent Articles
The GBP/NZD Magic Trick: How Genetic Algorithms Can Transform Your Forex Strategy
The British Pound-New Zealand Dollar: Genetic Algorithms and the Hidden Forces Shaping Currency Pairs
Chande Momentum Oscillator Hack for AUD/JPY
The Forgotten Momentum Trick That’s Quietly Dominating AUD/JPY Why Most Traders Miss the Signal
Bearish Market Hack HFT Firms Hope You’ll Never Learn
The One Bearish Market Hack High Frequency Traders Don't Want You to Know The
