
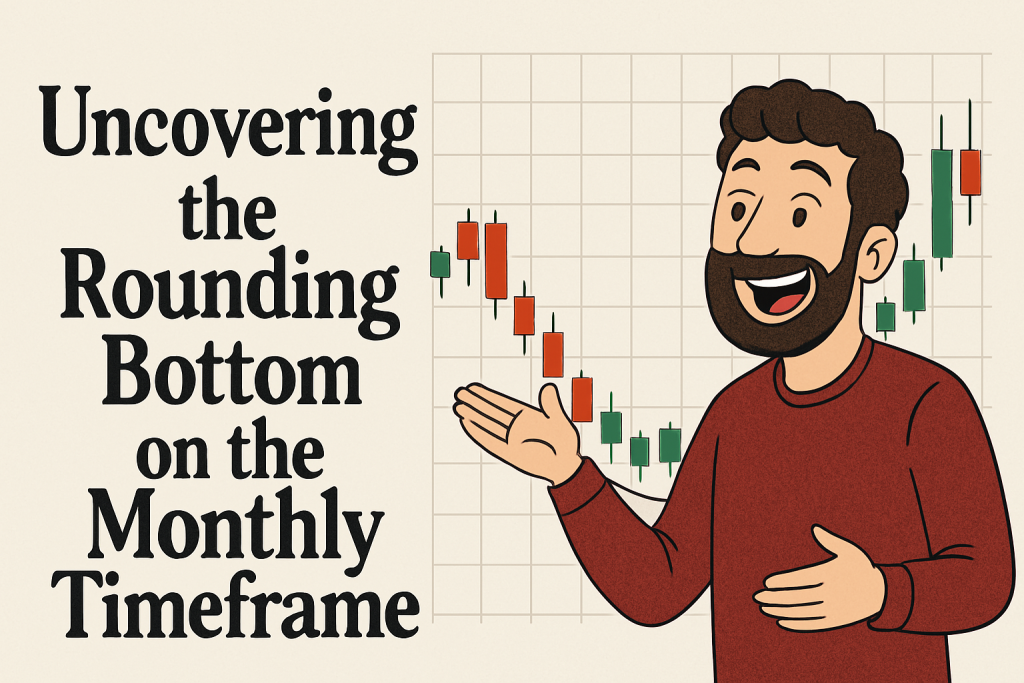
The Underground Code: How the Monthly Timeframe and Rounding Bottom Pattern Could Change Everything
Imagine staring at your screen, chart zoomed all the way in like you’re trying to find Waldo on a 1-minute chart. Your heart races, your mouse hovers over the buy button, and then—bam! Fakeout. Again. It’s like that time you bought that trendy kitchen gadget you never used (looking at you, avocado slicer). But what if you zoomed out instead of in? What if the answers were hiding on the monthly timeframe, disguised in a shape most traders overlook—the rounding bottom?
Welcome to the contrarian’s guide to spotting one of the most powerful, sneaky, and misunderstood setups in the market. This isn’t your average indicator party. This is a look behind the velvet curtain—where underground trends and strategic patience collide.
The Rounding Bottom: The Snail That Wins the Race
At first glance, the rounding bottom looks about as exciting as watching grass grow on a rainy day. But don’t be fooled. This pattern is like that quiet kid in class who ends up launching a billion-dollar tech startup.
What is it? The rounding bottom is a long-term reversal pattern that indicates a gradual shift from bearish to bullish sentiment. It’s shaped like a saucer or a slow ‘U’, often forming over several months or even years. It’s the market saying, “Okay, let’s take a breather… and then flip the script.”
Why It Works So Well on the Monthly Timeframe:
- It filters out noise: No more panic-selling over an hourly candle.
- Institutional-level perspective: Big players live on the monthly.
- Strategic patience wins: You spot moves that retail traders miss.
“When in doubt, zoom out.” – Linda Raschke, trading legend and wizard of market timing.
Why Most Traders Get It Wrong (And How You Can Avoid It)
Here’s the tragedy: Most traders never even see the rounding bottom. They’re too busy getting whiplash on the 15-minute chart. Or they see it but bail out halfway through the formation, mistaking slow momentum for a dead market.
Let’s set the record straight:
- Myth: Rounding bottoms are unreliable.
- Reality: On higher timeframes, they’re some of the most reliable signals in the game.
Common Pitfalls:
- Exiting too early – Traders get bored during the formation’s slow build-up.
- Confirmation bias – Seeing bearish patterns where none exist.
- Lack of macro understanding – Not aligning with fundamental drivers.
The Hidden Formula Only Experts Use
Here’s the real sauce: Experts combine the rounding bottom with macroeconomic confirmation.
Steps to Execute Like a Pro:
- Identify a rounding bottom forming on the monthly timeframe
- Look for at least 6-12 months of price action creating a smooth curve.
- Check macro alignment
- Is inflation easing? Rate hikes slowing? Economic data stabilizing?
- Look for volume confirmation
- Increasing volume on the right side = institutional buying.
- Use a trend continuation indicator
- RSI crossing above 50 or MACD bullish crossover.
- Set long-term entry with scaling-in strategy
- Add positions as price confirms breakout over neckline/resistance.
Rounding Bottom + Monthly = Strategic Nirvana
Here’s a true tale from the trenches: In 2020, EUR/CHF began forming a subtle rounding bottom on the monthly. Most traders ignored it. The Swiss franc was stable, the Euro was limping.
Fast forward to late 2021: Boom. Breakout. Over 800 pips in under five months.
According to a 2022 BIS report, over 73% of retail traders exit profitable trades too early—often before the breakout on monthly setups.
Moral of the story? The monthly timeframe gives you breathing room. You’re not caught in the ping-pong of intraday volatility.
Contrarian Tactics: Where the Money Really Hides
Still using the 4-hour chart to predict long-term market shifts? That’s like using a magnifying glass to scan a forest.
Here’s what the pros do:
- Spot macro rounding bottoms on monthly.
- Build long-term conviction positions.
- Use options, ETFs, or hedging for risk management.
Contrarian Tip: Combine the rounding bottom with the Commitment of Traders (COT) report to verify institutional sentiment. If large specs are flipping long, that’s your green light.
Bonus Tactic: Volume Profile Meets Rounding Bottom
Want to take it a notch higher? Layer in a volume profile.
- Identify high-volume nodes within the base.
- Use these as accumulation zones.
- When price breaks these zones—especially on the monthly—it’s often not coming back.
This is how hedge funds spot accumulation before the public catches on.
Insider Resources You’re Missing Out On (But Not Anymore)
Want to track these patterns before they break? Don’t rely on YouTube clickbait. Use real tools:
- Stay ahead with economic updates: Forex News Today
- Master the monthly with deep-dives: Free Forex Courses
- Surround yourself with elite minds: StarseedFX Community
- Plan your trades smarter: Free Trading Plan
- Track what really matters: Free Trading Journal
- Optimize every entry: Smart Trading Tool
Your Ninja Checklist: What to Look for in a Monthly Rounding Bottom
- Smooth U-shaped curve spanning 6–18 months
- Volume spike on right shoulder
- RSI climbing past 50
- MACD crossover confirmation
- Price reclaiming key long-term resistance (neckline)
- Institutional volume or COT shift
These signs are like a constellation guiding you through the noise. Ignore them, and you’re flying blind.
The One Simple Shift That Changes Everything
Here’s the wild part: Mastering the rounding bottom on the monthly doesn’t just change your entries—it transforms your mindset. It cultivates patience. Vision. Discipline. And, let’s be honest, fewer panic-induced button smashes.
You move from reacting to anticipating. From zoomed-in anxiety to big-picture confidence.
The monthly timeframe reveals a trader’s true story arc. You just have to be willing to read beyond the first chapter.
What You’ve Learned Today:
- The monthly timeframe helps you avoid noise and catch real reversals.
- Rounding bottoms are low-drama, high-reward setups.
- Most traders miss the breakout because they lack patience or perspective.
- Combining technicals with macro + volume = ninja-level insight.
- StarseedFX gives you the tools, resources, and community to apply this knowledge at the next level.
—————–
Image Credits: Cover image at the top is AI-generated
PLEASE NOTE: This is not trading advice. It is educational content. Markets are influenced by numerous factors, and their reactions can vary each time.

Anne Durrell & Mo
About the Author
Anne Durrell (aka Anne Abouzeid), a former teacher, has a unique talent for transforming complex Forex concepts into something easy, accessible, and even fun. With a blend of humor and in-depth market insight, Anne makes learning about Forex both enlightening and entertaining. She began her trading journey alongside her husband, Mohamed Abouzeid, and they have now been trading full-time for over 12 years.
Anne loves writing and sharing her expertise. For those new to trading, she provides a variety of free forex courses on StarseedFX. If you enjoy the content and want to support her work, consider joining The StarseedFX Community, where you will get daily market insights and trading alerts.
Share This Articles
Recent Articles
The GBP/NZD Magic Trick: How Genetic Algorithms Can Transform Your Forex Strategy
The British Pound-New Zealand Dollar: Genetic Algorithms and the Hidden Forces Shaping Currency Pairs
Chande Momentum Oscillator Hack for AUD/JPY
The Forgotten Momentum Trick That’s Quietly Dominating AUD/JPY Why Most Traders Miss the Signal
Bearish Market Hack HFT Firms Hope You’ll Never Learn
The One Bearish Market Hack High Frequency Traders Don't Want You to Know The
