
The Hidden Code of Bearish Markets: Mastering the Head and Shoulders Pattern Like a Pro
Why Most Traders Get It Wrong (And How You Can Avoid It)
Picture this: You see a textbook Head and Shoulders pattern forming on your chart. Excited, you place your trade, expecting the market to drop like your WiFi during a Zoom call. But instead, the price fakes out, skyrockets, and leaves your account looking like a ghost town. Sound familiar?
Most traders misinterpret the Head and Shoulders pattern, leading to poor execution and false breakouts. But here’s the kicker: professional traders don’t just rely on the shape—they dig deeper. They analyze volume, confirmation signals, and smart entry points to avoid fakeouts and capitalize on high-probability trades.
If you want to stop falling for market traps and start trading like a seasoned pro, buckle up—this article is your personal roadmap to mastering the Head and Shoulders pattern in a bearish market.
The “Head and Shoulders” Pattern: Why It’s the Market’s Worst-Kept Secret
If you’re new to technical analysis, the Head and Shoulders pattern is a bearish reversal pattern that signals a shift from an uptrend to a downtrend. Think of it as the market’s way of telling you: “Hey, the bulls are tired—time for the bears to take over.”
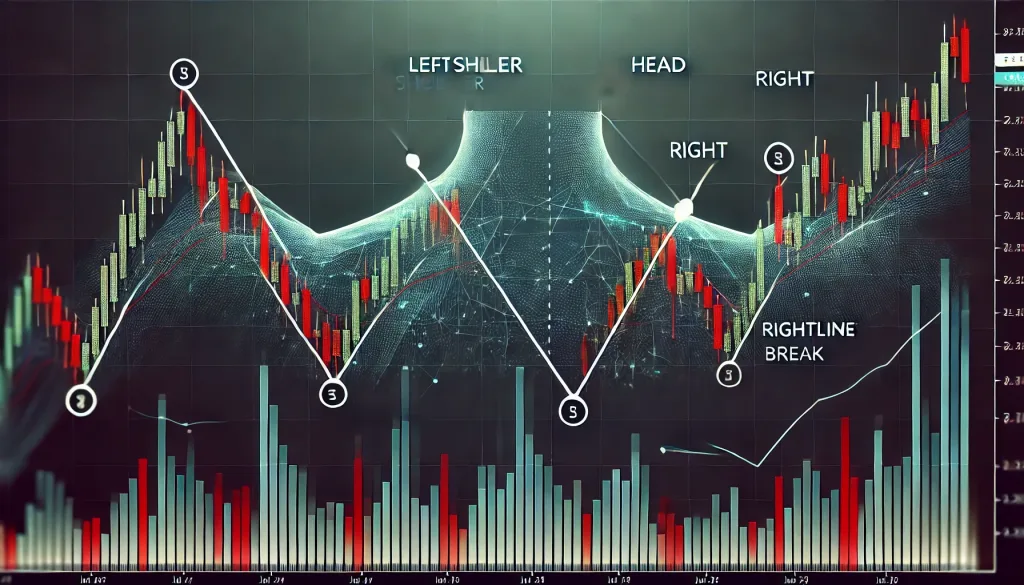
It consists of three peaks:
- Left Shoulder – A price rise, followed by a minor decline.
- Head – A higher peak, then another decline.
- Right Shoulder – A lower high, leading to a neckline break.
The neckline is the key support level. When the price breaks below the neckline, it’s like a trapdoor opening—expect a sharp fall.
The Secret Sauce: How Smart Traders Confirm the Pattern Before Entering
Most traders see the shape and jump in blindly. Bad move.
Here’s what the pros do instead:
✅ Volume Analysis: A true Head and Shoulders pattern is confirmed when the volume increases on the breakdown of the neckline. If the volume is weak, it’s likely a fakeout.
✅ Retest Strategy: Instead of entering right away, experienced traders wait for a retest of the neckline before shorting. If the price retests the neckline and fails to reclaim it, you have a high-probability short setup.
✅ EMA & RSI Confirmation: Combining Exponential Moving Averages (EMA) and Relative Strength Index (RSI) can provide extra confirmation. A bearish 50 EMA cross or an RSI drop below 50 adds conviction.
Elite Tactics for Trading Head and Shoulders in a Bearish Market
Let’s talk next-level trading tactics to sharpen your edge.
1. The Stop-Loss Trick That Saves Your Account
Most traders place their stop-loss above the right shoulder—and that’s exactly why they get hunted. Smart traders place it slightly above the head, ensuring market makers can’t shake them out.
2. The Hidden Breakout Confirmation
Not all neckline breaks are created equal. A true breakout should:
- Have strong bearish volume.
- Close below the neckline on higher timeframes (4H or Daily).
- Retest the neckline before continuing down.
3. The “Measured Move” Target Calculation
To project where price might go after breaking the neckline, use this formula:
- Measure the height from the head to the neckline.
- Subtract that from the neckline after the breakdown.
For example:
- Head at 1.2500, neckline at 1.2000 → Height = 500 pips.
- Project 500 pips down → Target = 1.1500.
Boom! You just calculated a realistic price target.
Case Study: The Trade That Shocked Traders in 2023
In March 2023, EUR/USD formed a perfect Head and Shoulders on the 4H timeframe. Many retail traders shorted immediately on the neckline break, only to watch in horror as price faked them out, reversed, and took out their stops.
What the smart money did differently:
- They waited for a retest before entering.
- They confirmed volume increase before shorting.
- They placed stops above the head, not the right shoulder.
Result? A massive 200+ pip drop, while impatient traders got liquidated.
Expert Insights: What the Pros Say About the Head and Shoulders Pattern
According to John Murphy, author of Technical Analysis of the Financial Markets:
“A true Head and Shoulders pattern is only confirmed when volume confirms the breakdown—otherwise, it’s just noise.”
Linda Raschke, a legendary trader, adds:
“The best traders wait for a retest of the neckline before entering. It’s a classic strategy that filters out weak setups.”
Final Takeaways: How to Never Fall for Fakeouts Again
???? Validate volume on the breakdown – If volume is weak, expect a fakeout.
???? Wait for the neckline retest – The safest entry is after confirmation.
???? Set smart stop-loss levels – Avoid easy liquidation traps.
???? Use EMA and RSI confluence – Strengthen your conviction before entering.
???? Calculate price targets with precision – Use the measured move formula.
Want to master high-probability Forex trading?
???? Join the StarseedFX Community for expert insights, live trade analysis, and exclusive market updates: https://starseedfx.com/community
???? Upgrade your skills with free Forex courses: https://starseedfx.com/free-forex-courses
—————–
Image Credits: Cover image at the top is AI-generated
PLEASE NOTE: This is not trading advice. It is educational content. Markets are influenced by numerous factors, and their reactions can vary each time.

Anne Durrell & Mo
About the Author
Anne Durrell (aka Anne Abouzeid), a former teacher, has a unique talent for transforming complex Forex concepts into something easy, accessible, and even fun. With a blend of humor and in-depth market insight, Anne makes learning about Forex both enlightening and entertaining. She began her trading journey alongside her husband, Mohamed Abouzeid, and they have now been trading full-time for over 12 years.
Anne loves writing and sharing her expertise. For those new to trading, she provides a variety of free forex courses on StarseedFX. If you enjoy the content and want to support her work, consider joining The StarseedFX Community, where you will get daily market insights and trading alerts.
Share This Articles
Recent Articles
The GBP/NZD Magic Trick: How Genetic Algorithms Can Transform Your Forex Strategy
The British Pound-New Zealand Dollar: Genetic Algorithms and the Hidden Forces Shaping Currency Pairs
Chande Momentum Oscillator Hack for AUD/JPY
The Forgotten Momentum Trick That’s Quietly Dominating AUD/JPY Why Most Traders Miss the Signal
Bearish Market Hack HFT Firms Hope You’ll Never Learn
The One Bearish Market Hack High Frequency Traders Don't Want You to Know The
