
Cup and Handle + Statistical Arbitrage: The Chart Pattern Hedge Funds Don’t Want You To Understand
You ever spot a cup and handle pattern and think, “Wow, that looks like the market just took a coffee break and came back with a vengeance?” Well, welcome to the land where art meets quant: the world of cup and handle patterns supercharged by statistical arbitrage.
Yes, this is not your everyday vanilla double top or RSI overbought signal. We’re diving into what happens when a classically bullish price pattern marries a cold, data-driven strategy that feels more MIT than Wall Street. Buckle up (wait, we said no cliches) — let’s say instead: sharpen your mind and stretch your intuition, because what you’re about to discover will upgrade your playbook.
The Hidden Geometry of Cup and Handle Patterns
First, let’s sip the obvious: the cup and handle is a bullish continuation pattern. But what most traders don’t realize? It’s not just a shape—it’s a volatility compression chamber followed by breakout energy.
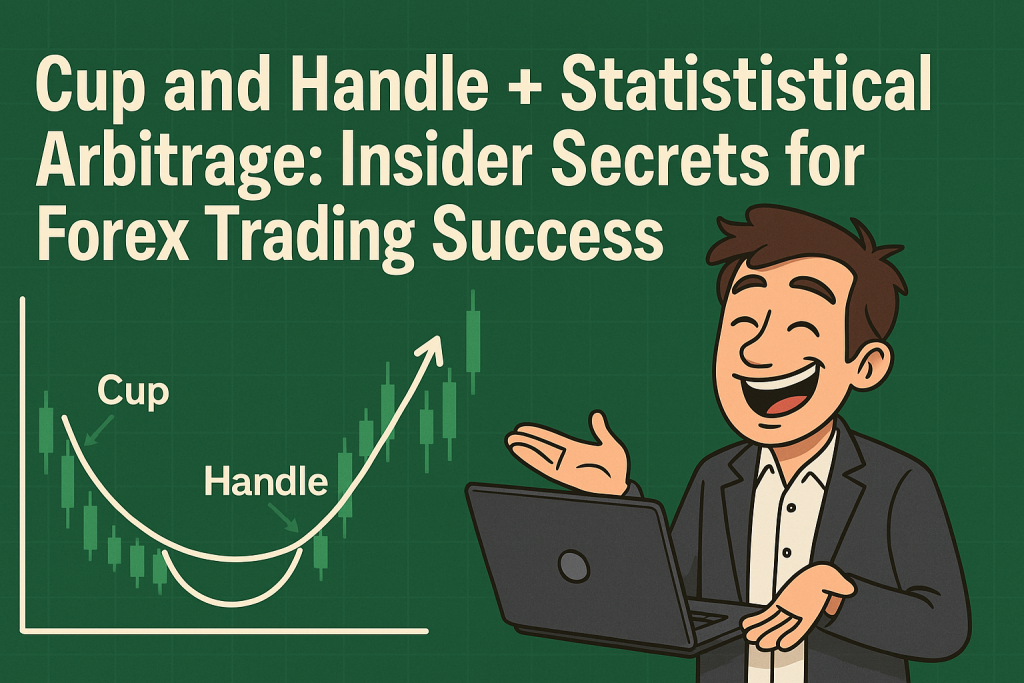
- Cup = A rounded bottom, showing a period of accumulation and decreased volatility. Think of it like the market catching its breath.
- Handle = A short-term pullback, usually on low volume, which fakes out impatient traders.
- Breakout = The moment when everyone who said, “It’s too quiet” realizes they should’ve listened to the silence.
But here’s the ninja move: most retail traders simply look for the breakout. Hedge funds? They track the volatility clusters, liquidity zones, and bid-ask imbalances within the cup and handle formation.
Insider Tip: According to a 2023 QuantInsti study, cup and handle breakouts paired with decreasing intraday volatility in the handle phase had a 68.3% probability of achieving a 2R target on EUR/USD within 5 sessions.
Statistical Arbitrage: Where Quants Feast and Retail Gets Left With Crumbs
Statistical arbitrage (aka stat arb) sounds intimidating. Like something you’d need a PhD in astrophysics to execute. But here’s the shocker:
Stat arb is basically exploiting mean-reverting relationships between assets, using math to time your entries better than gut feelings ever could.
Now imagine this. What if you had a cup and handle pattern forming on EUR/USD, but simultaneously you were tracking correlated pairs like EUR/CHF or EUR/GBP and using cointegration metrics to see if this breakout is statistically backed by intermarket behavior?
Game-changer? Absolutely.
The Hidden Formula Only Experts Use
Here’s how elite traders secretly blend the two:
- Detect the Pattern: Use an algo that identifies cup and handle formations across correlated pairs.
- Calculate Cointegration: Test for statistical relationships between the base pair and at least two others. If they’re cointegrated, chances are they’re moving in lockstep.
- Measure Spread Divergence: Find where the cup handle diverges from its statistical pair — that’s your “compression + divergence” moment.
- Enter with Confirmation: Wait for breakout in the main pair while confirming volatility or volume surges in secondary pairs.
Contrarian Insight: Most traders watch a single chart. Elite traders overlay their patterns with math.
Why Most Traders Get It Wrong (And How You Can Avoid It)
Here are the classic cup and handle sins:
- Entering too early (a.k.a. the “I got FOMO” entry)
- Ignoring volume dynamics
- Forgetting to zoom out and assess the macro-pair relationships
Instead, do this:
- Use volume weighted volatility to confirm the legitimacy of the handle.
- Pair it with stationarity checks across correlated pairs to spot mispricing.
- Avoid overfitting your strategy. If your cup and handle only works when Jupiter aligns with Mars and you had coffee twice that week, it’s too fragile.
The Underground Strategy Nobody Talks About
Here’s a dirty little secret: top prop firms often fade failed cup and handle patterns.
Why?
Because false breakouts offer some of the best risk-reward setups when timed statistically.
Try this:
- Track failed breakouts after the handle.
- Measure volume divergence vs. expected breakout volume.
- Use Z-score filters to see if the move is outside expected distribution.
If the breakout is weak and statistically unsupported by correlated pairs, fade it with tight stops.
Funny how a failed dream can make you money, huh?
How to Predict Market Moves with Precision
Here’s a simple checklist you can follow to use cup and handle with statistical arbitrage:
- Identify Pattern: Confirm at least 30 candles forming a rounded base followed by a short pullback.
- Check Volume: The handle should show low volume.
- Cross-Asset Check: Analyze cointegration with at least two correlated Forex pairs.
- Breakout Analysis:
- Use Bollinger Band squeeze as volatility confirmation.
- Confirm surge in correlated pairs.
- Quant Score Filter: Create a score based on:
- Cointegration strength (0-10)
- Volatility alignment (0-10)
- Spread divergence (0-10)
- Pattern symmetry (0-10)
Score above 30? Green light.
Real-World Example: EUR/USD and the Silent Boom
In August 2024, a textbook cup and handle formed on the EUR/USD 4-hour chart. Retail traders called it late, but quants at a London-based prop desk were already in. Why?
- EUR/CHF and EUR/GBP showed low-volatility compression with positive drift.
- Volume dropped in the handle, while cointegration metrics hit 0.89 (statistically significant).
- Breakout occurred during the EU session with confirmation from EUR/CHF volatility surge.
Outcome: +120 pips in 2 days.
Retail forums called it luck. But the pros called it math.
Don’t Miss the Silent Signals: Ninja Tactics You Can Use Today
- Volume Symmetry Check: If your cup’s volume mirrors its handle like a mirror selfie, you’re likely on the right path.
- Heatmap Overlay: Use liquidity heatmaps to visualize trap zones.
- Smart Money Bias: Track order flow on secondary pairs for early signals.
Elite Tactics Recap: Upgrade Your Arsenal
- Use cointegration to validate breakouts.
- Look for handle-phase compression across correlated pairs.
- Score setups using a custom quant filter.
- Consider fading statistically unsupported breakouts.
- Leverage volume symmetry and liquidity heatmaps to avoid traps.
Need More Firepower? We Got You.
- Want real-time alerts on cup and handle + stat arb setups? Join the StarseedFX Community
- Need a next-level strategy journal that tracks this data automatically? Snag our free trading journal
- Looking for the blueprint to build your own setup scorecard? Get our free trading plan
—————–
Image Credits: Cover image at the top is AI-generated
PLEASE NOTE: This is not trading advice. It is educational content. Markets are influenced by numerous factors, and their reactions can vary each time.

Anne Durrell & Mo
About the Author
Anne Durrell (aka Anne Abouzeid), a former teacher, has a unique talent for transforming complex Forex concepts into something easy, accessible, and even fun. With a blend of humor and in-depth market insight, Anne makes learning about Forex both enlightening and entertaining. She began her trading journey alongside her husband, Mohamed Abouzeid, and they have now been trading full-time for over 12 years.
Anne loves writing and sharing her expertise. For those new to trading, she provides a variety of free forex courses on StarseedFX. If you enjoy the content and want to support her work, consider joining The StarseedFX Community, where you will get daily market insights and trading alerts.
Share This Articles
Recent Articles
The GBP/NZD Magic Trick: How Genetic Algorithms Can Transform Your Forex Strategy
The British Pound-New Zealand Dollar: Genetic Algorithms and the Hidden Forces Shaping Currency Pairs
Chande Momentum Oscillator Hack for AUD/JPY
The Forgotten Momentum Trick That’s Quietly Dominating AUD/JPY Why Most Traders Miss the Signal
Bearish Market Hack HFT Firms Hope You’ll Never Learn
The One Bearish Market Hack High Frequency Traders Don't Want You to Know The
