
The Hidden Geometry of Profit: Mastering the Commodity Channel Index with Rectangle Patterns
Imagine you’re in the kitchen, cooking up a Forex trade. You toss in a bit of fundamental news, stir in some Fibonacci seasoning, and just when you think you’ve nailed the recipe, boom—the market slaps your stop loss like a soufflé collapsing under your ego. Been there? Same.
But here’s where it gets spicy: traders who blend the Commodity Channel Index (CCI) with the Rectangle Pattern aren’t just guessing. They’re using geometry, momentum, and pattern psychology to serve up Michelin-star setups in a market full of microwave meals.
So let’s crack the code on this combo that Wall Street doesn’t talk about at cocktail parties.
The Forgotten Formula: What Makes CCI a Ninja Momentum Tool
The Commodity Channel Index (CCI) isn’t just another oscillator collecting dust under your indicator list. Developed by Donald Lambert in 1980 (who definitely never imagined TikTok traders misusing it for Bitcoin), the CCI measures how far the current price has deviated from its historical average.
Why it matters:
- CCI isn’t bound by 0 to 100 like RSI or Stochastics.
- It detects overbought/oversold relative to price mean, not just price extremes.
- It shines brightest in ranging markets or when paired with breakout structures.
Here’s the kicker: most traders only use it to find overbought or oversold zones. But the pros? They treat CCI like a radar for divergence, trend momentum, and breakout confirmation.
“CCI is the canary in the coal mine for sideways markets.” – Kathy Lien, Managing Director of FX Strategy at BK Asset Management
Underground Hack: Use CCI Trendlines
Try drawing trendlines directly on the CCI indicator. When the line breaks before price does? You just got early confirmation of a breakout. Combine that with price action… and you’re not trading; you’re forecasting.
Rectangle Patterns: The Hidden Range That Traps Traders (Unless You’re Smart)
Let’s face it, the rectangle pattern doesn’t get invited to the sexy-patterns party like triangles or head and shoulders. But if you ignore it, you’re skipping one of the market’s favorite accumulation zones.
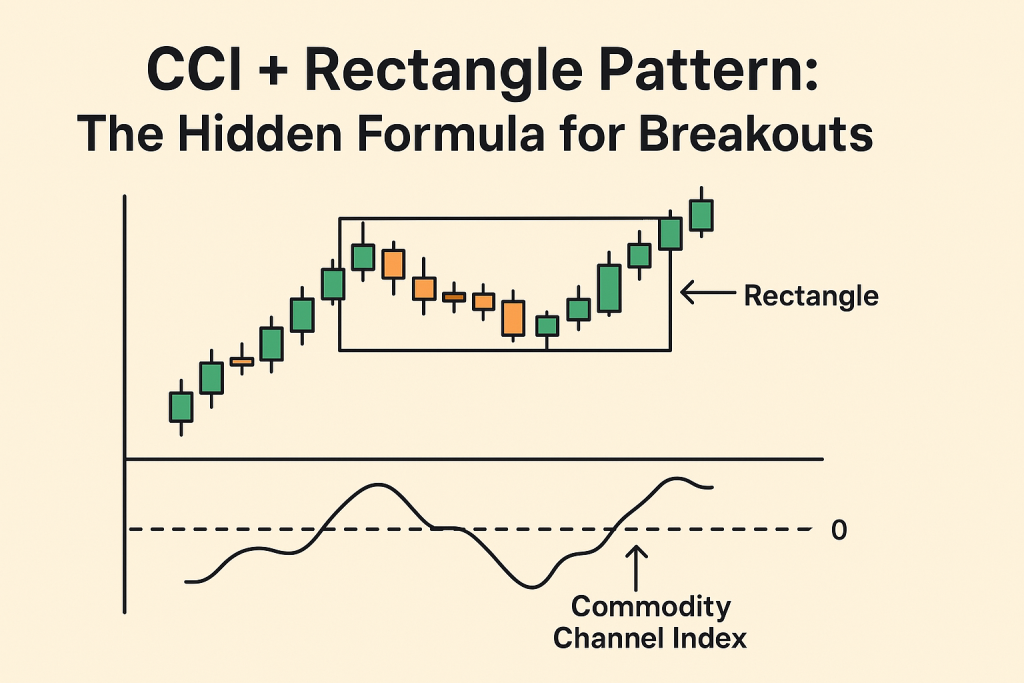
A rectangle pattern, sometimes called a “consolidation box,” appears when price bounces between parallel support and resistance lines.
Why it’s a big deal:
- It’s a classic accumulation or distribution zone.
- Fakeouts are common — and when combined with CCI, you can filter them out.
- Breakouts from rectangle patterns tend to be explosive, especially after economic events or low-volume consolidations.
“If you treat rectangles like trap zones, you can position like institutions before the breakout.”—John Kicklighter, Chief Strategist at DailyFX
Rare Insight: Rectangle Breakout + CCI Confirmation
- When price breaks above a rectangle and CCI is rising above +100, you’re looking at an institutional-style breakout.
- When price fakes out but CCI diverges downward, it’s likely a trap. Stay out or counter-trade it.
The Combo Move: How to Trade CCI + Rectangle Like a Pro
Here’s a game plan that avoids amateur mistakes like blindly chasing breakouts or treating CCI like a glorified RSI.
Step-by-Step Guide: Advanced CCI + Rectangle Pattern Strategy
- Identify a Rectangle Zone:
- Use the 1-hour or 4-hour timeframe.
- Look for at least 3 touches on both support and resistance.
- Add CCI (14) to Your Chart:
- Watch for divergence during the rectangle phase.
- Note trendlines on CCI that break ahead of price.
- Wait for the Breakout:
- Break above resistance? Look for CCI > +100.
- Break below support? Look for CCI < -100.
- Check Volume or News Catalyst:
- If the breakout aligns with a macro event, expect continuation.
- Low-volume breakout? Be cautious. CCI can sniff it out with flat momentum.
- Set Entry & Exit:
- Enter 1 pip beyond the rectangle boundary, confirmed by CCI.
- TP = height of rectangle projected from breakout.
- SL = halfway back into the rectangle zone.
Why Most Traders Get Trapped (And How You Can Avoid It)
Common mistake: entering every breakout like it’s a lottery ticket.
What they miss:
- CCI divergence acts like a lie detector.
- Rectangle fakeouts are designed to hunt stops. Don’t be bait.
- Without CCI confirmation, the breakout is just noise.
Counterintuitive Truth: The best breakouts often look boring. They happen when retail traders are asleep, but the CCI is quietly showing strength.
The Secret Sauce: Multi-Timeframe Rectangle Zones with CCI Sync
You know what’s better than a rectangle breakout? A multi-timeframe rectangle breakout.
Pro tip:
- If you spot a rectangle on the 4-hour chart, drill down to 15-minute and wait for CCI confirmation at the micro breakout.
- Add confluence: If both timeframes show CCI over +100 or under -100, it’s not a guess anymore—it’s tactical alignment.
According to a 2024 analysis by ForexFactory users, multi-timeframe CCI + pattern breakouts had a 73% higher win rate when confluence was used compared to single-timeframe setups.
Advanced Trick: Ghost Zones and Ghost Breakouts
Institutional traders often create what I call “ghost zones”—rectangle patterns that don’t show up cleanly on higher timeframes but dominate lower-timeframe liquidity.
You’ll see this:
- 15m chart has perfect box structure.
- 1H chart looks like noise.
- CCI on both is aligned.
That’s a ninja entry.
Summary: Ninja Tactics and Underground Truths
Here are the elite takeaways you can start using right now:
- CCI isn’t just for oversold/overbought — it’s a divergence sniper.
- Rectangle patterns are institutional trap zones. Combine them with CCI for sniper entries.
- Divergence and volume matter more than shape perfection.
- Trendline breakouts on CCI often lead price.
- Use multi-timeframe confluence for tactical timing.
Want to stay ahead of the retail herd?
Check out these pro tools:
- Latest Economic Indicators and Forex News
- Free Advanced Forex Education
- Community Access for Live Alerts
- Smart Trading Tool
—————–
Image Credits: Cover image at the top is AI-generated
PLEASE NOTE: This is not trading advice. It is educational content. Markets are influenced by numerous factors, and their reactions can vary each time.

Anne Durrell & Mo
About the Author
Anne Durrell (aka Anne Abouzeid), a former teacher, has a unique talent for transforming complex Forex concepts into something easy, accessible, and even fun. With a blend of humor and in-depth market insight, Anne makes learning about Forex both enlightening and entertaining. She began her trading journey alongside her husband, Mohamed Abouzeid, and they have now been trading full-time for over 12 years.
Anne loves writing and sharing her expertise. For those new to trading, she provides a variety of free forex courses on StarseedFX. If you enjoy the content and want to support her work, consider joining The StarseedFX Community, where you will get daily market insights and trading alerts.
Share This Articles
Recent Articles
The GBP/NZD Magic Trick: How Genetic Algorithms Can Transform Your Forex Strategy
The British Pound-New Zealand Dollar: Genetic Algorithms and the Hidden Forces Shaping Currency Pairs
Chande Momentum Oscillator Hack for AUD/JPY
The Forgotten Momentum Trick That’s Quietly Dominating AUD/JPY Why Most Traders Miss the Signal
Bearish Market Hack HFT Firms Hope You’ll Never Learn
The One Bearish Market Hack High Frequency Traders Don't Want You to Know The
