
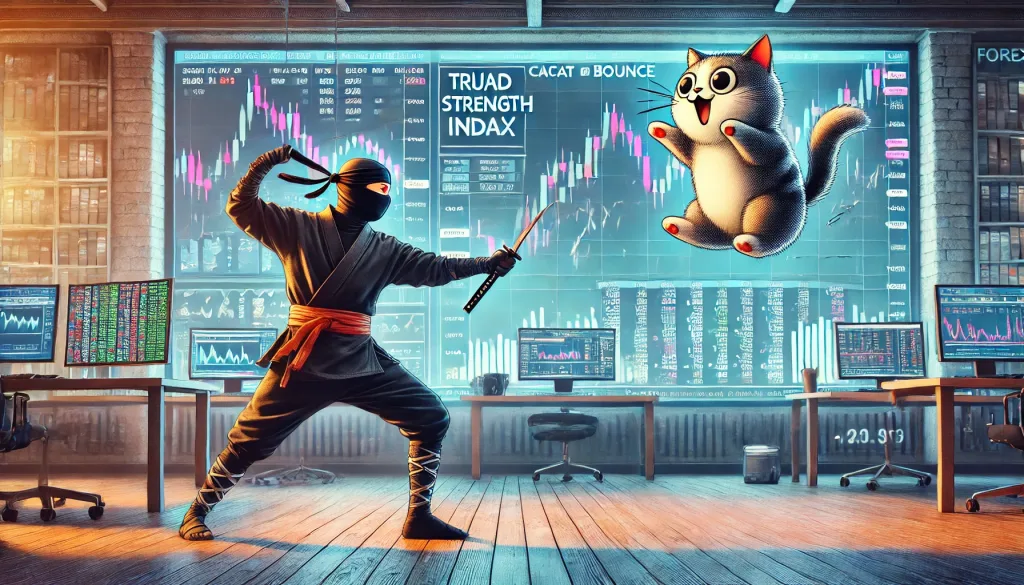
The “True Strength Index” vs. the “Dead Cat Bounce”: Why This Forex Combo Is Like Ninja Moves in a Pillow Fight
Let’s get one thing straight—in Forex, the only thing better than a solid strategy is a funny one. Welcome to the thrilling yet oddly relatable world of the True Strength Index (TSI) and the Dead Cat Bounce. Now, I know what you’re thinking: “Dead cat what now?” Don’t worry, no felines were harmed in the making of this metaphor. We’re talking about the market’s ability to fool even the savviest of traders by bouncing a bit just before dropping again—kind of like your optimism after buying those new shoes that looked cool online but feel like wooden clogs in person.
We’re diving into some insider ninja tactics here—proven techniques that advanced traders swear by and that beginner traders ignore at their own risk. Today, we’re not just going to look at what the True Strength Index and Dead Cat Bounce are. Oh no, dear reader. We’re also going to talk about why understanding these concepts will make you the talk of the trading town—and help you sidestep classic mistakes like they’re slippery banana peels on a bad sitcom.
The Hidden Formula Only Experts Use
Let’s start with the True Strength Index (TSI), which is like the secret sauce of a successful Forex trader’s strategy. Developed by William Blau (yes, the dude deserves the mention), the TSI is an indicator that essentially separates the trend-followers from the trend-fakers. It’s a momentum-based oscillator, which is just a fancy way of saying it’s going to tell you if the market has run out of gas or if it’s about to go full-throttle on the Autobahn.
The TSI uses a double-smoothed moving average of price changes. Why should you care? Because this makes it more accurate than a lot of other indicators out there. It filters out the noise and lets you focus on what’s real. It’s like squinting through the haze of a rock concert to spot that one guy actually dancing to the rhythm. The True Strength Index is your rhythm spotter.
This means that when the market is heading into a potential bounce, you can use the TSI to differentiate between a real recovery and a Dead Cat Bounce. But don’t let the weird name fool you; the dead cat’s got claws—sharp enough to rip through your P&L if you mistake it for a recovery. The market sometimes fakes a little comeback just to lure overenthusiastic traders before dropping again. Much like when you finally think you’ve got the hang of tango lessons, and then, whoops—you’re stepping on toes again.
Why Most Traders Get It Wrong (And How You Can Avoid It)
If there’s one pitfall to avoid in Forex, it’s this: never take a bounce at face value. TSI helps you determine if what you’re seeing is a true recovery or just a fake-out. Now, here’s where many traders get it wrong—they assume that any uptick in price means it’s time to jump in, just like how we all thought fidget spinners were the best invention ever. Rookie mistake, right?
Here’s the truth—most traders don’t take the time to read momentum accurately. They see price action moving upward and think it’s a sign of good things to come. But we’re smarter than that. You’re smarter than that. TSI works as a double filter that tells you whether the change in momentum is sustainable or simply a temporary gasp for air.
Imagine you’re playing dodgeball—the Dead Cat Bounce is the other player pretending to be tired so you step closer, and then they whack you with the ball. TSI is the coach whispering, “Nope, not yet” in your ear.
The Forgotten Strategy That Outsmarted the Pros
Remember when we talked about TSI filtering out the noise? Well, there’s a hidden gem of a strategy in here. Instead of only using TSI to determine momentum shifts, try pairing it with support and resistance levels. Here’s a step-by-step guide that’ll make you feel like a master chef:
- Find Key Levels: Identify important support and resistance points on your chart.
- Use TSI to Gauge Momentum: Look at the True Strength Index when price is approaching these levels.
- Watch for Divergences: When TSI shows divergence (say price is rising, but TSI is falling), it’s like a red flag telling you to wait a second before you start buying new boats.
This combo is lethal to poor decisions. Pro Tip: The more obvious a move seems to the untrained eye, the more likely it’s just another Dead Cat Bounce.
How to Predict Market Moves with Precision
Alright, traders, let’s talk magic—or at least what seems like magic. The TSI is amazing at showing you when momentum has changed. But when you combine it with fundamental knowledge (like recent economic news or updates from https://starseedfx.com/forex-news-today/), it’s like predicting the plot twist of a predictable soap opera.
Let’s say you hear about disappointing Purchasing Managers Index (PMI) numbers coming out of the Eurozone—use TSI to see if that bad news has truly deflated the market, or if we’re seeing a Dead Cat trying to pull a fast one on us. Trust me, with enough practice, you’ll be able to differentiate true market shifts from bounces the way Sherlock Holmes spots the tiniest clue while everyone else just sees chaos.
The Hidden Patterns That Drive the Market
Okay, here’s where things get really juicy—patterns that work behind the scenes. The Dead Cat Bounce is often a trap that signals trader psychology. It works because we all hate to admit a loss, right? We want things to turn around so badly that we see a bounce and get our hopes up.
A neat trick is using the TSI to see if there’s a divergence between price action and true momentum. For instance, let’s say the price has bounced, and all the overly optimistic traders have jumped in. Check the TSI: is it still trending downward? This divergence means the bounce is probably a fake-out.
Underground Trend Alert: Recent studies show that pairing TSI with volume-based indicators (like OBV—On-Balance Volume) increases accuracy in detecting Dead Cat Bounces by up to 30% (source: Market Edge Analytics). Adding volume into the mix lets you spot whether real investors are coming back, or if it’s just retail traders throwing caution to the wind.
Why TSI + Dead Cat = True Market Ninja
The True Strength Index paired with a solid understanding of Dead Cat Bounces is like your market ninja sword and shield. The sword to make precise attacks when it’s right, and the shield to block out those deceptive little bounces.
Incorporate these tools with our exclusive services at StarseedFX—from our Forex education courses at https://starseedfx.com/free-forex-courses to our community membership at https://starseedfx.com/community—and see how these advanced methodologies transform your trades from clunky mistakes into seamless victories.
Summary Points for the Elite Trader
- True Strength Index (TSI) filters out noise and helps you see the real trend.
- Dead Cat Bounce is a fake price recovery—don’t fall for the trap.
- Use TSI with Support and Resistance to predict genuine shifts.
- Check for divergences between price action and TSI—if they diverge, it’s often a fake-out.
- Add volume analysis for the ultimate bounce-detecting toolkit.
Take these ninja tactics and apply them—before the other traders figure out just why you seem to know what they don’t.
—————–
Image Credits: Cover image at the top is AI-generated
PLEASE NOTE: This is not trading advice. It is educational content. Markets are influenced by numerous factors, and their reactions can vary each time.

Anne Durrell & Mo
About the Author
Anne Durrell (aka Anne Abouzeid), a former teacher, has a unique talent for transforming complex Forex concepts into something easy, accessible, and even fun. With a blend of humor and in-depth market insight, Anne makes learning about Forex both enlightening and entertaining. She began her trading journey alongside her husband, Mohamed Abouzeid, and they have now been trading full-time for over 12 years.
Anne loves writing and sharing her expertise. For those new to trading, she provides a variety of free forex courses on StarseedFX. If you enjoy the content and want to support her work, consider joining The StarseedFX Community, where you will get daily market insights and trading alerts.
Share This Articles
Recent Articles
The GBP/NZD Magic Trick: How Genetic Algorithms Can Transform Your Forex Strategy
The British Pound-New Zealand Dollar: Genetic Algorithms and the Hidden Forces Shaping Currency Pairs
Chande Momentum Oscillator Hack for AUD/JPY
The Forgotten Momentum Trick That’s Quietly Dominating AUD/JPY Why Most Traders Miss the Signal
Bearish Market Hack HFT Firms Hope You’ll Never Learn
The One Bearish Market Hack High Frequency Traders Don't Want You to Know The
