
The Forex Secret No One Talks About
Picture this: You’re staring at your trading screen, coffee in hand, and there it is — a descending triangle forming on the quarterly chart. Most traders overlook it, dismissing it as just another geometric shape they can’t quite remember from high school. But what if I told you that this little shape, this sneaky descending triangle, holds the keys to some very hefty profits? Buckle up, because today we’re diving into how the quarterly descending triangle can become your unfair advantage in Forex.
Quarterly Descending Triangles: The Underrated Superstar
Now, before you roll your eyes thinking, “Another geometry lesson? I thought I left those behind with my TI-83 calculator,” hear me out. A descending triangle is not just some trading chart ornament—it’s the “silent killer” of Forex. Think of it like a cat quietly stalking its prey. Traders who know how to read this pattern can pounce with near-surgical precision, while others are still fumbling around trying to figure out why their positions are bleeding pips.
Here’s the deal: Descending triangles on the quarterly time frame are like those vintage wines you hear connoisseurs rave about. Patience is required. And if there’s one thing we traders are famously short on, it’s patience (unless we’re waiting on a 1-pip profit). But waiting for a descending triangle to complete on a quarterly chart? That’s where the big players separate from the hobbyists. It’s about seeing the bigger picture and not panicking at every price move.
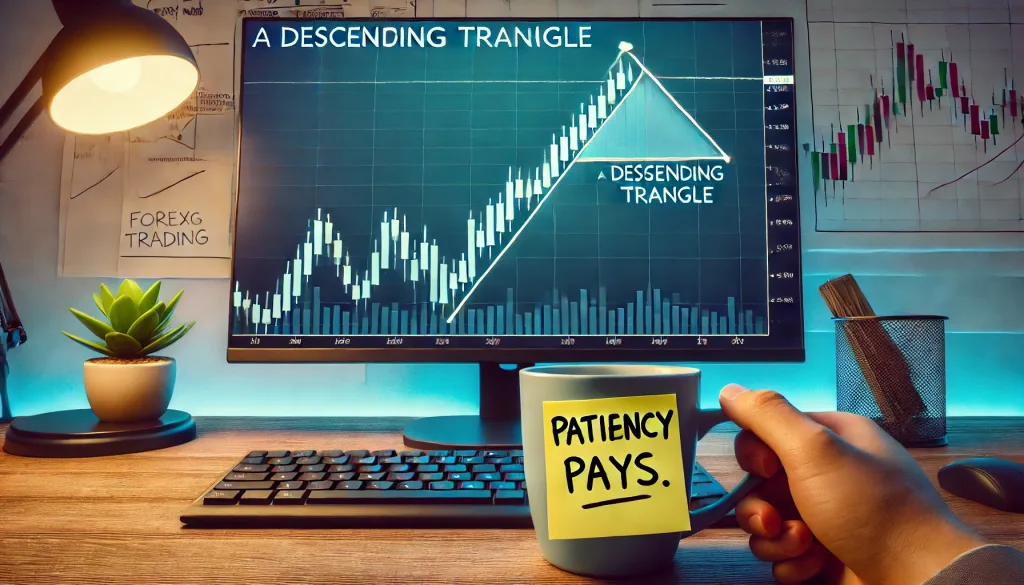
The Anatomy of the Triangle: Breaking It Down
A descending triangle forms when there’s a horizontal support line (picture a sturdy floor) and a series of lower highs pressing down on it, like a ceiling that’s gradually collapsing under the weight of too many bad trading decisions. The market is essentially showing that the sellers are becoming more aggressive, repeatedly pushing the price lower, and buyers are fighting to maintain their ground at support—until eventually, something has to give.
Picture a scene from your favorite sitcom: someone overzealously trying to push an overflowing suitcase closed. The support line is the zipper, struggling to contain the chaos. The lower highs are all the clothes being squashed in. Eventually, there’s that moment of truth: the suitcase either stays zipped, or everything bursts out in a comedic fashion. In Forex, that “bursting out” could mean a solid breakout trade opportunity—or a chance to watch the market do the exact opposite of what you expected (because the market always has a sense of humor).
Patience Is a Virtue… and a Profitable Strategy
So, what’s the play here? The quarterly descending triangle is like that friend who takes ages to get ready but looks absolutely stunning when they finally show up. You need patience to wait for the right breakout. The payoff, however, can be substantial. When price breaks below the support level—and it often does, given the consistent pressure from sellers—a major price move can ensue, making it one of those “where were you when…” market moments.
The real trick lies in not jumping the gun. Ever find yourself clicking the “sell” button prematurely, only to watch the price reverse and make you feel like you just bought a Bitcoin pizza back in 2010? Yeah, same. Instead, wait for volume confirmation—this is your signal that the sellers mean business, not just throwing a tantrum like a toddler at bedtime.
Hidden Opportunities: Ninja Tactics for Mastering the Descending Triangle
Let me share a contrarian perspective here: while most traders look for a short entry when the support finally gives way, there’s a secret little maneuver that few think about—trading the fakeout. You see, occasionally, that support line holds just long enough to lure in all the breakout traders, only to have the price slingshot upwards when they all get squeezed. The technical term for this is “trap the impatient” (okay, I made that term up, but you get the idea).
The key is to look for what I call the “bounce fakeout” on the quarterly descending triangle. When volume diminishes and price reverses above the support level, it can be a rare opportunity for a contrarian long entry—particularly if you notice key economic indicators aligning (like, say, an unexpectedly strong PMI reading). Yes, I know—this is not the conventional approach, and it’s definitely not for the faint of heart. But trading is part strategy, part guts—and all about the right timing.
Bringing in the Experts: What They Say About Descending Triangles
To bring in a bit of authoritative weight (so you know I’m not just a guy making triangles with his hands at the screen), here’s what John J. Murphy, the famed technical analyst, has to say: “Descending triangles are inherently bearish, but context is king. The pattern’s power increases with time and confirmation.” That confirmation often happens on the quarterly level, where patterns really show their strength.
Another expert, Kathy Lien, says, “Timing breakouts requires understanding not just the pattern but the market psychology behind it—especially on larger time frames.” And she’s absolutely spot on. It’s about getting inside the collective head of traders and understanding when those support levels are about to get smoked.
Step-by-Step Playbook for the Descending Triangle
Here’s your actionable plan for mastering this sneaky pattern:
- Identify the Triangle on a Quarterly Chart: This is the hardest part—waiting for this setup might take longer than a teenage phase, but it’s worth it.
- Wait for Volume Confirmation: Don’t jump in because you think it’s a breakout. Look for volume spikes that say, “We’re serious about this, buddy.”
- Consider a Fakeout Entry: For those wanting to be more creative and aggressive, watch for diminished volume and a sudden bullish reversal above support. This could be a golden opportunity for a long play.
- Set Your Stop-Loss Strategically: If you’re short, just above the last lower high. If you’re taking the contrarian long, just below the support. Because let’s face it, getting stopped out is better than hoping things will reverse while staring at a red sea.
- Target Price Projection: Use the height of the triangle to project your potential target. And no—you can’t pick an arbitrary spot just because it’s a “nice round number” like 1.2000. Let’s be precise, like you’re making an important decision in your favorite strategy game.
Wrapping It Up: From Geometry Class to Cash
The quarterly descending triangle isn’t just a snoozefest you half remember from high school math—it’s a powerful pattern that, when spotted and executed with care, can deliver serious returns. It’s all about patience, volume, and knowing when to pounce (or to take a calculated risk on a fakeout). Remember, the key to making this pattern work for you lies in timing, discipline, and knowing what the majority of traders will do—then doing the exact opposite when the opportunity calls for it.
So, next time you see that descending triangle slowly forming on a quarterly chart, don’t sigh and move on. Grab another cup of coffee, put on your best patient face, and get ready to cash in on what the crowd misses.
—————–
Image Credits: Cover image at the top is AI-generated
PLEASE NOTE: This is not trading advice. It is educational content. Markets are influenced by numerous factors, and their reactions can vary each time.

Anne Durrell & Mo
About the Author
Anne Durrell (aka Anne Abouzeid), a former teacher, has a unique talent for transforming complex Forex concepts into something easy, accessible, and even fun. With a blend of humor and in-depth market insight, Anne makes learning about Forex both enlightening and entertaining. She began her trading journey alongside her husband, Mohamed Abouzeid, and they have now been trading full-time for over 12 years.
Anne loves writing and sharing her expertise. For those new to trading, she provides a variety of free forex courses on StarseedFX. If you enjoy the content and want to support her work, consider joining The StarseedFX Community, where you will get daily market insights and trading alerts.
Share This Articles
Recent Articles
The GBP/NZD Magic Trick: How Genetic Algorithms Can Transform Your Forex Strategy
The British Pound-New Zealand Dollar: Genetic Algorithms and the Hidden Forces Shaping Currency Pairs
Chande Momentum Oscillator Hack for AUD/JPY
The Forgotten Momentum Trick That’s Quietly Dominating AUD/JPY Why Most Traders Miss the Signal
Bearish Market Hack HFT Firms Hope You’ll Never Learn
The One Bearish Market Hack High Frequency Traders Don't Want You to Know The
