
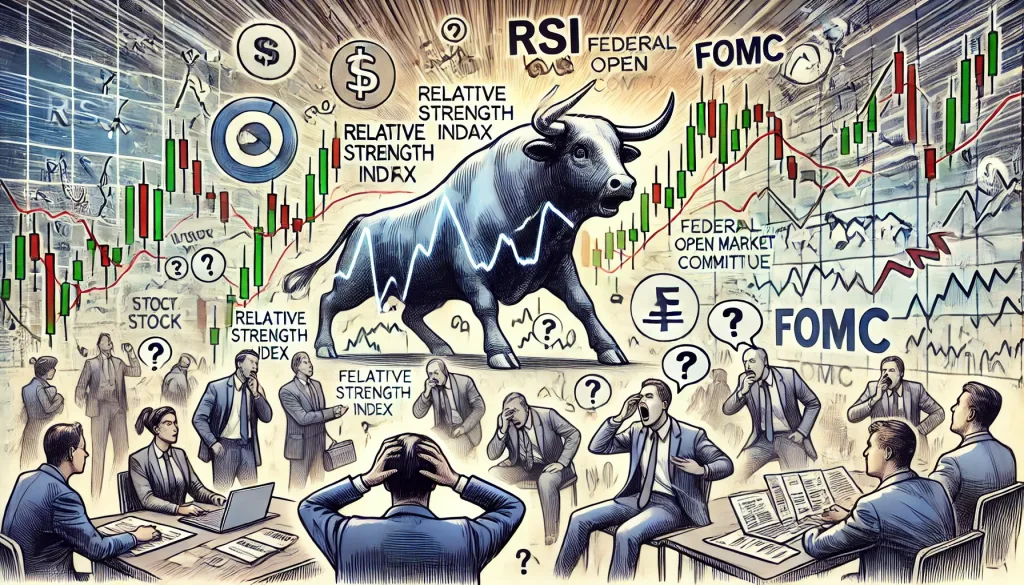
The RSI & FOMC Dance: Discovering Little-Known Secrets for Insider Success
Ah, the RSI—that good ol’ Relative Strength Index. It’s a tool that every trader has heard of, but not everyone knows how to tango with it properly. Add the FOMC—the Federal Open Market Committee—into the mix, and suddenly you’ve got yourself a dance that looks more like a plot twist from a soap opera. There are ups, downs, and dramatic pauses where the market just kind of stares at itself in the mirror. But fear not, dear traders. Today, we’re digging into the hidden gems of how to use RSI like a secret weapon during FOMC announcements. Let’s break it down, step by step—with a few giggles along the way.
Why Most Traders Get RSI Wrong (And How You Can Avoid It)
A lot of traders use RSI as if it’s an open invitation to get in on overbought or oversold conditions. If you’ve ever blindly bought at an RSI reading below 30 and sold above 70, you might know that feeling—the same as when you buy a pair of shoes just because they’re on sale, but you never actually wear them. Well, that’s how RSI sometimes works: tempting, seemingly logical, but potentially utterly useless if you don’t use context.
During FOMC announcements, traders tend to freak out—understandably, since the Fed practically controls how much your money will be worth. If RSI is your trusty sidekick, it’s not about just buying because “RSI says so.” Oh no, it’s about looking at that RSI reading in context. Picture this: The Fed chair is making that all-important rate decision, and you notice RSI indicating oversold territory right before the announcement—like a bad sitcom where someone yells, “Don’t do it!” Guess what? If the market reacts with rate cuts or dovish tones, oversold might turn into a trampoline for prices—or a trap door, depending on your foresight.
The Hidden Patterns That Drive the Market
Let’s look at those magical FOMC days. They’re where hidden patterns love to hang out—much like those friends who only show up when there’s free pizza. A contrarian technique we’ll unveil here is about recognizing the divergence in RSI during these announcements. If the RSI forms a divergence—say price moves higher but RSI falls—right before or during an FOMC statement, it’s a red flag. It’s like seeing someone pulling open an umbrella before the sky is even cloudy; it might be sunny, but someone knows that rain’s coming.
Watch out for these moments—hidden patterns emerge that only the truly attentive traders catch. And no, they’re not printed in textbooks. A hidden divergence during FOMC indicates that smart money might be slipping out the back door while retail traders are distracted by big headlines. Look for those moments when price action and RSI have a silent disagreement—those are your “behind-the-scenes” trading signals.
The Forgotten Strategy That Outsmarted the Pros
Remember those textbook lessons on ‘trend-following’ RSI during news events? Probably not, because no one likes reading dusty textbooks when you can have fun with real examples—but let’s keep this simple. Here’s a forgotten strategy that’s helped outsmart even the smartest in the room: waiting for the second reaction.
You see, FOMC reactions are like toddlers hyped up on sugar—first reactions are all over the place, dramatic, with lots of up-and-down tantrums. But then comes a quiet pause, and that’s where we learn to listen. During that second reaction—a sort of “Oh wait, let’s think this through” moment—that’s when you bring RSI into play. If the RSI aligns with the broader market sentiment and price pulls back to give you an entry, you’ve found your trading sweet spot.
How to Predict Market Moves with Precision
The idea that the market is chaotic is true—but there’s still order within that chaos. RSI during FOMC announcements becomes especially powerful when you use it to predict where the market is likely to go next, and not just what it’s doing right now.
Picture yourself watching a race—just like those kids’ sack races on a sports day. You’ve got traders jumping in their sacks, hopping left and right. RSI tells you how tired the hoppers are. FOMC tells you when someone’s about to get pushed to sprint. Use RSI to gauge fatigue—is the market already winded, hopping at an overbought zone, and now the FOMC news is about to kick it further? That’s the moment to look for price exhaustion and to act with precision. Just like knowing when that sack race is about to end in a photo finish, positioning yourself well can give you a winning trade.
The Hidden Formula Only Experts Use
Alright, here’s the secret: RSI is not just about numbers; it’s about context. When mixed with FOMC news, RSI acts as a reality check for the market’s irrationality. The formula—if we must boil it down—is:
RSI + Market Sentiment + Price Action Leading to Announcement = Hidden Opportunity.
The magic happens when you use RSI to figure out whether price action is responding rationally or with emotion—and we all know how unpredictable emotions can be. Remember, trading isn’t just about data—it’s also about people. People panic, rejoice, and overreact—and so does the market during FOMC announcements.
—————–
Image Credits: Cover image at the top is AI-generated
PLEASE NOTE: This is not trading advice. It is educational content. Markets are influenced by numerous factors, and their reactions can vary each time.

Anne Durrell & Mo
About the Author
Anne Durrell (aka Anne Abouzeid), a former teacher, has a unique talent for transforming complex Forex concepts into something easy, accessible, and even fun. With a blend of humor and in-depth market insight, Anne makes learning about Forex both enlightening and entertaining. She began her trading journey alongside her husband, Mohamed Abouzeid, and they have now been trading full-time for over 12 years.
Anne loves writing and sharing her expertise. For those new to trading, she provides a variety of free forex courses on StarseedFX. If you enjoy the content and want to support her work, consider joining The StarseedFX Community, where you will get daily market insights and trading alerts.
Share This Articles
Recent Articles
The GBP/NZD Magic Trick: How Genetic Algorithms Can Transform Your Forex Strategy
The British Pound-New Zealand Dollar: Genetic Algorithms and the Hidden Forces Shaping Currency Pairs
Chande Momentum Oscillator Hack for AUD/JPY
The Forgotten Momentum Trick That’s Quietly Dominating AUD/JPY Why Most Traders Miss the Signal
Bearish Market Hack HFT Firms Hope You’ll Never Learn
The One Bearish Market Hack High Frequency Traders Don't Want You to Know The
