
The RSI + Inverse Head and Shoulders Hack Traders Don’t Want You to Know (But Definitely Should)
When the RSI Meets the Reversal King
If the Relative Strength Index (RSI) is the cool-headed detective in your trading toolbox, then the Inverse Head and Shoulders pattern is its unpredictable sidekick who somehow always cracks the case. Now imagine these two teaming up. Think “Sherlock Holmes meets a caffeine-charged Watson with a penchant for chart patterns.” It’s a combo that could turn your trading game from Netflix binge-level passive to Wall Street ninja active.
Main keywords: RSI + Inverse Head and Shoulders. You’ll find this dynamic duo showing up more frequently on Forex charts than cat videos in your TikTok feed. And trust me, when used correctly, they can help you uncover trades most retail traders completely miss. Like spotting an underpriced Birkin bag at a flea market.
Let’s get into the kind of rare trading synergy that makes institutional traders smirk knowingly while retail traders just stare blankly at their MetaTrader 4.
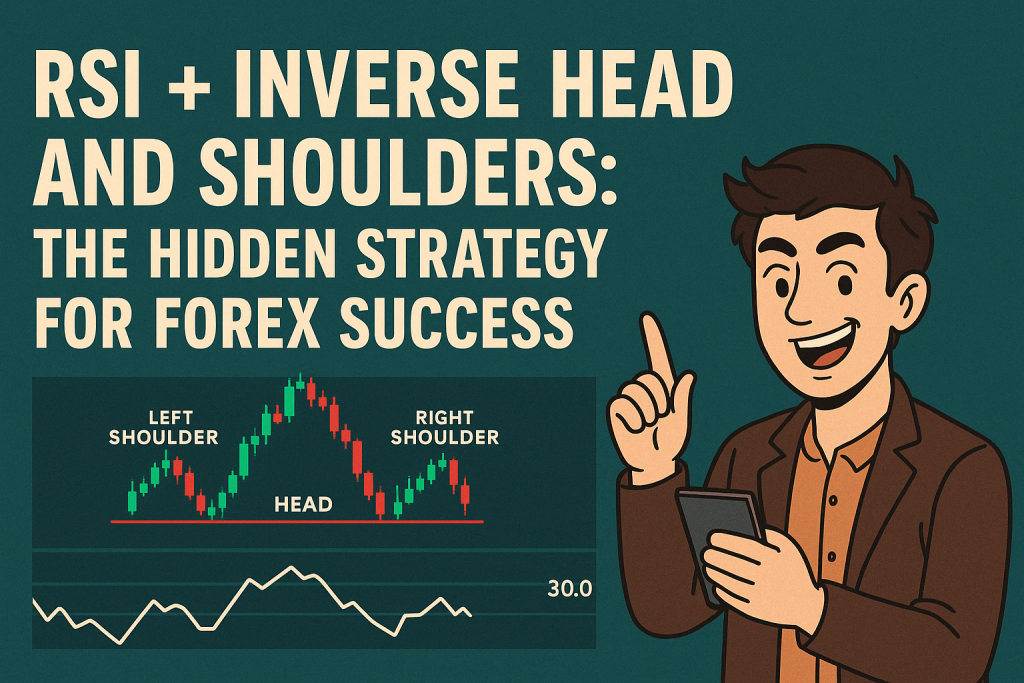
Why the Inverse Head and Shoulders Gets the Spotlight (Even Without the RSI)
You know that feeling when you finally realize you’ve been microwaving pizza wrong your entire life? That’s how traders feel when they truly grasp the Inverse Head and Shoulders (IHS). This bullish reversal pattern often pops up at the end of a downtrend, right when everyone’s too scared to buy, and that’s what makes it chef’s kiss delicious for contrarian setups.
Here’s what you’re looking for:
- Left Shoulder: Price drops and pulls back.
- Head: Price drops lower than the left shoulder, then pulls back again.
- Right Shoulder: Price drops, but not as low as the head, then rises.
- Neckline: The resistance level connecting the pullbacks. When price breaks this with volume, that’s your signal.
Pro Tip: Don’t just wait for the neckline break—combine it with RSI divergences for next-level confirmations.
The RSI Isn’t Just a Momentum Tool—It’s a Lie Detector
The RSI doesn’t just whisper “overbought” and “oversold” like a sleepy math teacher. It exposes hidden truths—especially divergence.
RSI Bullish Divergence: The Real MVP When price prints lower lows but RSI prints higher lows, that’s called bullish divergence. It’s like the market is lying to your face with price action, but RSI’s out here snitching.
Combine this with an IHS setup? Now you’re not just trading a pattern, you’re trading a pattern confirmed by momentum betrayal. That’s like having CCTV footage to back up your alibi. Pure trader power move.
The Sweet Spot: How to Trade the RSI + IHS Combo Like a Pro
Now that we’re past the flirty introductions, here’s the playbook:
Step-by-Step Guide:
- Spot the Pattern: Look for the classic IHS structure at the end of a downtrend.
- Check RSI: Ensure RSI is showing bullish divergence during the right shoulder or head formation.
- Draw the Neckline: Connect the two highs between the shoulders and the head.
- Wait for Breakout + RSI Confirmation: Look for a neckline break with RSI crossing above 50.
- Entry: Enter long on the candle that closes above the neckline.
- Stop-Loss: Place it just below the right shoulder.
- Target: Measure the distance from head to neckline and project it upward from the breakout point.
Bonus Ninja Move: Check volume on the breakout. Increased volume adds serious credibility, like a verified blue tick on X.
Why Most Traders Get It Wrong (And How You Can Flip the Script)
Let’s call out some of the myths and mistakes, shall we?
- Myth 1: RSI is only useful for overbought/oversold signals.
- Reality: RSI divergence is one of the most underutilized confirmation tools for pattern breakouts.
- Myth 2: IHS patterns only work on daily timeframes.
- Reality: The combo works on any timeframe with liquidity. Try it on H4 or even M15 for precise scalps.
- Myth 3: You should enter at the first sign of an IHS.
- Reality: Patience, young padawan. Wait for neckline + RSI confirmation. Otherwise, you’re just guessing with style.
Case Study: EURUSD – October 2024
EURUSD formed a textbook inverse head and shoulders on the H4 chart following a sharp decline. RSI printed a bullish divergence right on the head.
- Breakout happened with RSI at 57.
- Volume spiked.
- Price surged 180 pips in 3 sessions.
- Risk-reward on trade? 1:3.4.
Moral of the Story: Patterns + momentum confirmation = alpha.
Real Experts Weigh In
According to Kathy Lien, Managing Director at BK Asset Management, “Momentum divergence is one of the most overlooked entry filters. When used with patterns, it increases win probability significantly.”
Steve Nison, the godfather of candlesticks, once said: “The synergy of patterns and indicators offers clarity that pure price action often misses.”
The Secret Sauce Retail Traders Overlook
If you’re just waiting for the neckline to break without checking RSI, you’re flying blind with half a radar. Combining RSI with IHS uncovers hidden bullish strength early.
Extra Gems:
- Use RSI on a higher timeframe to avoid fakeouts.
- Look for RSI crossing 50 post-breakout as added confirmation.
- Always confirm with volume. RSI + IHS + volume = Institutional blueprint.
Next-Level Tactics from the StarseedFX Arsenal
If you’re serious about mastering this technique, we’ve got the perfect tools for you:
- Daily Insider Alerts with real-time IHS + RSI setups: Join StarseedFX Community
- Smart Trading Tool that tracks RSI divergences automatically: Get It Here
- Free Forex Education on how to master indicator-based strategies: Start Learning
Elite Takeaways: What You’ve Just Unlocked
- How to combine RSI and Inverse Head and Shoulders for high-probability setups.
- Step-by-step trade plan that blends structure, momentum, and confirmation.
- Why most traders misuse RSI and IHS—and how to capitalize on their mistakes.
- Exclusive tools and community insights at StarseedFX.
—————–
Image Credits: Cover image at the top is AI-generated
PLEASE NOTE: This is not trading advice. It is educational content. Markets are influenced by numerous factors, and their reactions can vary each time.

Anne Durrell & Mo
About the Author
Anne Durrell (aka Anne Abouzeid), a former teacher, has a unique talent for transforming complex Forex concepts into something easy, accessible, and even fun. With a blend of humor and in-depth market insight, Anne makes learning about Forex both enlightening and entertaining. She began her trading journey alongside her husband, Mohamed Abouzeid, and they have now been trading full-time for over 12 years.
Anne loves writing and sharing her expertise. For those new to trading, she provides a variety of free forex courses on StarseedFX. If you enjoy the content and want to support her work, consider joining The StarseedFX Community, where you will get daily market insights and trading alerts.
Share This Articles
Recent Articles
The GBP/NZD Magic Trick: How Genetic Algorithms Can Transform Your Forex Strategy
The British Pound-New Zealand Dollar: Genetic Algorithms and the Hidden Forces Shaping Currency Pairs
Chande Momentum Oscillator Hack for AUD/JPY
The Forgotten Momentum Trick That’s Quietly Dominating AUD/JPY Why Most Traders Miss the Signal
Bearish Market Hack HFT Firms Hope You’ll Never Learn
The One Bearish Market Hack High Frequency Traders Don't Want You to Know The
