
The Underground Guide to Trading the Business Confidence Index with the Bullish Flag Pattern
The Pattern Wall Street Doesn’t Want You to Master
You ever make a trade so bad you consider changing your name and moving to a Wi-Fi-free island? We’ve all been there. But here’s the secret sauce most traders never taste: combining economic indicators with technical setups can uncover trades so juicy, you’d think they were grilled at a five-star steakhouse. Today, we’re cracking open a powerhouse combo—the Business Confidence Index and the Bullish Flag pattern.
Most traders either get hypnotized by chart patterns or obsess over macro data, but few know how to fuse them. Those who do? They walk like ninjas through volatile markets, dodging noise and striking with sniper-level accuracy.
Let’s dive into how to become one of them.
Why the Business Confidence Index Is the Market’s Mood Ring
The Business Confidence Index (BCI) is like the espresso shot for the economic outlook. Published monthly by organizations like the OECD, this little gem measures the optimism or pessimism of business leaders. Think of it as reading the facial expression of the economy before it says a word.
- BCI above 100? Businesses are feeling themselves. Expansion is on the menu.
- BCI below 100? The vibe is recession-y. Expect contraction or at least a coffee break from growth.
According to a 2024 OECD report, a rise in BCI above the 101.5 threshold historically correlates with increased investment flows and stronger local currency trends within 3-6 months. (Source)
So what does this mean for traders?
If the BCI is perking up, sentiment is aligning with risk-on assets. Pair that with a bullish flag breakout, and you might just be holding a golden ticket.
The Bullish Flag: Not Just a Pretty Pattern
Most folks see the bullish flag and treat it like a pretty painting: “Oh look, it’s waving. Must be bullish.” No. This is not a museum. This is war.
The bullish flag is the market catching its breath before sprinting again. Price rallies strongly (the flagpole), then consolidates in a tight downward-sloping channel (the flag), before exploding upwards again.
What makes it potent?
- Volume Confirmation: Initial surge has high volume. Consolidation has declining volume. Breakout = volume returns like caffeine to a trader at 3 a.m.
- Measured Move: The flagpole length projected from the breakout gives a strong target.
Fun Fact: According to Bulkowski’s chart pattern studies, bullish flags break upward 67% of the time with an average gain of 12% within 3 weeks. (Source)
But here’s where the real magic happens…
Where Macro Meets the Micro: The Strategy That Outsmarts the Herd
Imagine this: Business Confidence Index just crossed the 101 line. EUR/USD is forming a textbook bullish flag. While everyone is still arguing in trading forums about Fibonacci extensions, you quietly execute this:
Step-by-Step Ninja Strategy:
- Track the BCI Monthly Releases:
- Get them from the OECD or local central bank calendars.
- Use a 3-month rolling average to confirm sustained sentiment, not just a one-off sugar rush.
- Overlay Flag Pattern on Currency Pairs of the BCI’s Country:
- If German BCI is up, scan EUR crosses.
- Look for recent strong rallies followed by tight pullbacks.
- Add Confluence:
- Use a 21 EMA for trend support.
- Watch RSI for hidden bullish divergence during the flag.
- Set Entry and Exit:
- Entry: Break above the flag with volume.
- Target: Flagpole height added to breakout.
- Stop Loss: Just below flag consolidation.
- Bonus: Cross-reference with StarseedFX’s Smart Trading Tool to calculate position size and manage orders.
Insider Tip: Trade Laggards, Not Leaders
When BCI is bullish, everyone piles into the obvious pairs. Want alpha? Find the laggards. If the EUR/CHF hasn’t broken out yet but EUR/USD has, guess who’s next in line to shine?
Think of it like shopping a day after Black Friday. The crowds are gone, but the deals are still there.
Myth-Busting: Why Most Traders Miss This Move
Let’s clear the air on a few common misconceptions:
- Myth #1: Economic indicators are for long-term investors only.
- Reality: Short-term traders can use them as catalysts for breakout moves.
- Myth #2: Chart patterns don’t work in volatile environments.
- Reality: They work better when paired with real-world catalysts like BCI.
- Myth #3: Business sentiment is priced in.
- Reality: Market reactions lag sentiment data, offering a tactical edge.
The Hidden Patterns That Drive the Market
Here’s a juicy nugget: in Q4 2023, the Australian BCI spiked to a 5-year high. Shortly after, the AUD/NZD formed a bullish flag and surged 200 pips over 10 days. Coincidence? Nope. Pattern.
Pairing sentiment with structure is like GPS plus Google Reviews—you’re not just heading in the right direction, you’re going somewhere good.
“When sentiment aligns with structure, you’re not just trading the chart. You’re trading conviction.” — Kathy Lien, Managing Director of FX Strategy at BK Asset Management
“The most successful traders build confluence into their strategies—price, volume, macro, structure. It’s not optional; it’s essential.” — John Kicklighter, Chief Strategist at DailyFX
StarseedFX Resources: Your Trading Arsenal
Ready to take this strategy next level?
- Get real-time BCI updates and economic insights at Forex News Today.
- Explore our free advanced strategy courses at Forex Courses.
- Join the elite trading community for daily setups and alerts at StarseedFX Community.
- Create a personalized trading plan at Free Trading Plan.
- Sharpen your edge with our Free Trading Journal.
- Automate smarter decisions with the Smart Trading Tool.
Elite Tactics Recap: What You Just Unlocked
- How to fuse macroeconomic data with chart patterns for precision entries.
- How to interpret BCI signals like a market psychologist.
- How to execute high-conviction trades using a multi-layered approach.
- Why lagging pairs can offer the best setups.
- Real-world examples that prove the power of this fusion.
Let’s Keep the Conversation Going
Ever paired BCI with a chart pattern before? Have a favorite macro-technical combo that works like magic? Drop your thoughts below, share your setups, or challenge yourself to spot a bullish flag aligned with this month’s BCI release.
Remember, trading isn’t just about having the right tools—it’s about knowing when and how to use them.
Stay sharp, stay stealthy.
—————–
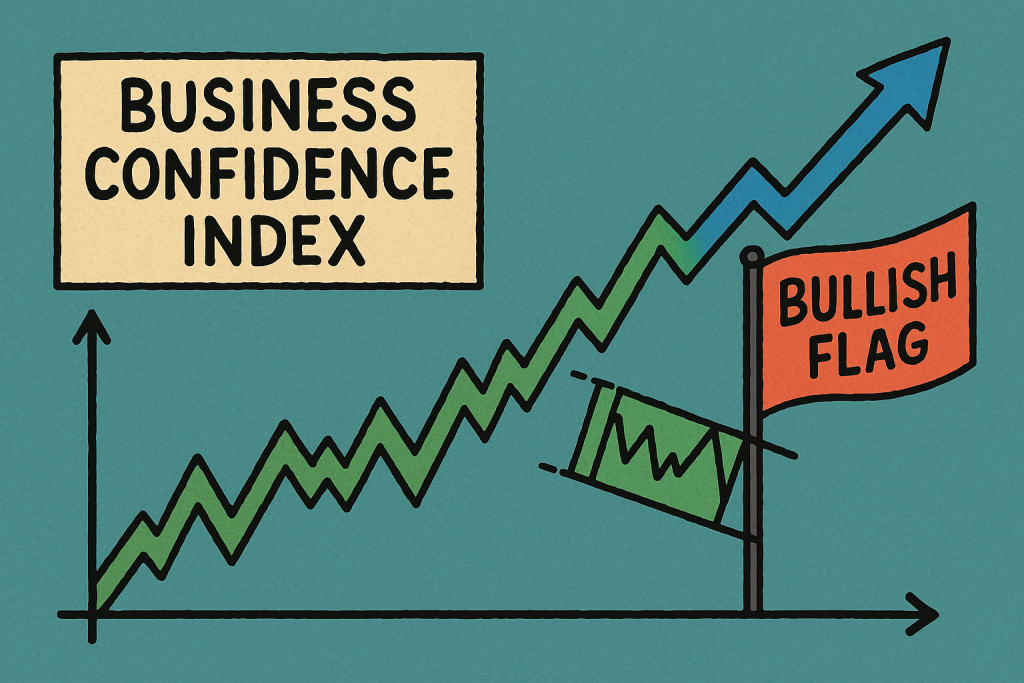
Image Credits: Cover image at the top is AI-generated
PLEASE NOTE: This is not trading advice. It is educational content. Markets are influenced by numerous factors, and their reactions can vary each time.

Anne Durrell & Mo
About the Author
Anne Durrell (aka Anne Abouzeid), a former teacher, has a unique talent for transforming complex Forex concepts into something easy, accessible, and even fun. With a blend of humor and in-depth market insight, Anne makes learning about Forex both enlightening and entertaining. She began her trading journey alongside her husband, Mohamed Abouzeid, and they have now been trading full-time for over 12 years.
Anne loves writing and sharing her expertise. For those new to trading, she provides a variety of free forex courses on StarseedFX. If you enjoy the content and want to support her work, consider joining The StarseedFX Community, where you will get daily market insights and trading alerts.
Share This Articles
Recent Articles
The GBP/NZD Magic Trick: How Genetic Algorithms Can Transform Your Forex Strategy
The British Pound-New Zealand Dollar: Genetic Algorithms and the Hidden Forces Shaping Currency Pairs
Chande Momentum Oscillator Hack for AUD/JPY
The Forgotten Momentum Trick That’s Quietly Dominating AUD/JPY Why Most Traders Miss the Signal
Bearish Market Hack HFT Firms Hope You’ll Never Learn
The One Bearish Market Hack High Frequency Traders Don't Want You to Know The
