
US Dollar Swiss Franc Head and Shoulders Strategy That Outsmarts the Crowd
The Weird Pattern That Predicted the USD/CHF Reversal Before Wall Street Even Noticed
Trading the US Dollar Swiss Franc pair with a head and shoulders setup is like showing up to a black-tie gala wearing X-ray specs: you see what’s beneath the surface before anyone else even gets suspicious. But here’s the real kicker: this chart pattern isn’t just for textbook theorists or Forex nerds. When used right, it can be a radar for market manipulation, institutional exhaustion, and early exits before the trend screams “I give up!”
Now, if you’re thinking, “Oh great, another blog telling me about head and shoulders…”, pause. Because what we’re about to cover isn’t your basic neckline-break-and-pray strategy. We’re diving deep into contrarian setups, volatility traps, and even hidden divergences that institutional traders don’t want retail folks to spot.
Let’s expose the chart secrets behind the USD/CHF head and shoulders pattern that most traders miss—and how you can use it to sidestep the 90% failure rate that plagues the herd.
The Shoulder Shrug Most Traders Ignore
Most traders treat the left and right shoulders like Tinder dates—quick to judge and rarely studied. But the real alpha? It’s hiding in the volume profile and market structure of those shoulder formations.
Here’s what they don’t teach in standard courses:
- If the right shoulder forms on lower volume and fails to break a significant pivot high, it’s a sign of buyer fatigue.
- If the neckline isn’t horizontal but slightly upward-sloping, it’s often a bait trap for breakout traders.
According to Al Brooks, a former futures trader and technical analysis expert: “False breakouts in patterns like head and shoulders are the easiest traps for professionals to spring.”
Pro Tip: Use the Volume Oscillator to compare volume intensity during left shoulder vs. right shoulder development. When the right shoulder has a negative oscillator reading, odds of a failed rally skyrocket.
The Hidden Divergence Trick Institutions Hope You Never Learn
Okay, so you’re staring at a textbook head and shoulders pattern. Neat. But what if I told you there’s an under-the-hood signal that adds a sniper-scope layer to your entries?
It’s called momentum divergence stacking:
- Check RSI or CCI on each shoulder peak.
- Confirm if the right shoulder’s momentum is notably weaker, even when price is similar.
- Add a third layer: MACD histogram or Rate of Change.
If all three indicators disagree with the price highs on the right shoulder, it’s not just a signal. It’s a market confession.
As Linda Raschke, trading veteran and market wizard, puts it: “The best trades come from clear divergences, not clear patterns.”
Hidden gem tip: Pair this divergence detection with the Smart Trading Tool from StarseedFX. It calculates optimal order size and alerts you when a divergence aligns with pattern confirmation.
Why Most USD/CHF Traders Get It Wrong (And How You Can Flip the Script)
Let’s be brutally honest. Most retail traders spot a head and shoulders on USD/CHF, wait for the neckline to break, enter on the candle close, and set a stop loss tighter than a nightclub’s dress code.
Here’s why that’s a fast-track ticket to Stop Loss City:
- USD/CHF often fakes out on the first neckline break.
- Volatility spikes around macro events like Swiss National Bank (SNB) announcements or US CPI.
- Institutions love to wick out retail stops just below “obvious” levels.
Instead, try this ninja setup:
- Wait for the neckline to break and retrace back to retest it.
- Look for a bullish/bearish engulfing candle on the retest, not on the break.
- Add confluence: is the neckline also a Fibonacci level or VWAP zone?
Better yet, confirm the setup during low liquidity periods, like post-London pre-New York open, when big players love to reposition.
The Forgotten Strategy That Outsmarted the Pros in 2024
In Q4 2024, while everyone was screaming about Bitcoin ETFs and bond yield curve inversions, smart traders quietly banked 280+ pips on USD/CHF by spotting a hidden head and shoulders that formed across the 6-hour chart.
Here’s how it went down:
- The pattern emerged between October 15 and November 2.
- The right shoulder looked like a bullish continuation—but RSI was silently screaming bearish divergence.
- A confluence with the SNB policy statement caused a volatile spike, triggering a fakeout above the right shoulder.
- Price then cratered 300 pips.
This move was mapped out days in advance by a few elite traders in the StarseedFX Community, where pattern + divergence + news timing = trifecta trades.
Moral of the story? Timing beats prediction. And yes, sometimes doing the opposite of what Twitter gurus say is the real edge.
The Step-by-Step Guide to Mastering the Head and Shoulders on USD/CHF
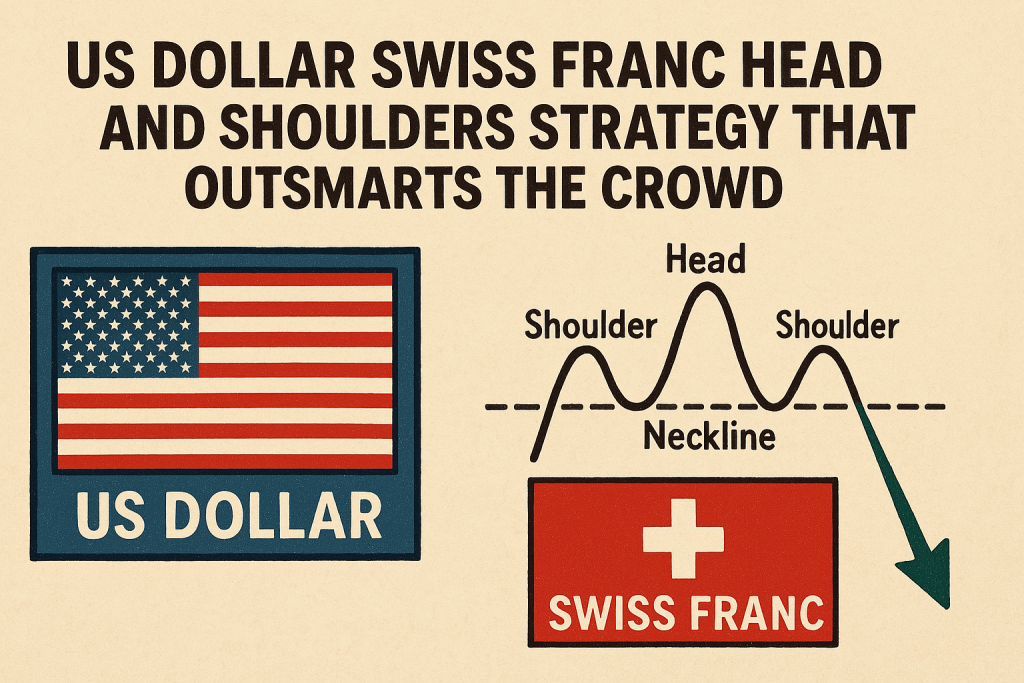
- Identify the Pattern:
- Look for three peaks: left shoulder, head (highest), right shoulder.
- Measure Volume:
- Use Volume Oscillator or OBV to confirm falling interest in the right shoulder.
- Check Momentum Divergence:
- Compare RSI, MACD, and CCI values between shoulders.
- Wait for the Neckline Break:
- Don’t rush; fakeouts are common.
- Retest Confirmation:
- Enter after price retests the neckline and rejects it.
- Set Strategic Stops:
- Use ATR or the Smart Trading Tool to avoid tight stops.
- Add Context:
- Is there an upcoming SNB or Fed event? Zoom out to see broader sentiment.
- Track Progress:
- Log each trade in the Free Trading Journal to review performance patterns.
Final Takeaways: Ninja Tactics for USD/CHF Pattern Traders
- Don’t just trade the pattern—decode its volume and divergence layers.
- Think in terms of traps: who’s being lured, and who’s setting the bait?
- Confirm with context: fundamentals, market sentiment, and time of day.
- Use tools like the Smart Trading Tool and Free Trading Plan to enhance execution.
- Join the StarseedFX Community to get access to insider setups, live alerts, and next-level trading banter.
Because in a market full of patterns, the one who reads between the lines writes the profit story.
—————–
Image Credits: Cover image at the top is AI-generated
PLEASE NOTE: This is not trading advice. It is educational content. Markets are influenced by numerous factors, and their reactions can vary each time.

Anne Durrell & Mo
About the Author
Anne Durrell (aka Anne Abouzeid), a former teacher, has a unique talent for transforming complex Forex concepts into something easy, accessible, and even fun. With a blend of humor and in-depth market insight, Anne makes learning about Forex both enlightening and entertaining. She began her trading journey alongside her husband, Mohamed Abouzeid, and they have now been trading full-time for over 12 years.
Anne loves writing and sharing her expertise. For those new to trading, she provides a variety of free forex courses on StarseedFX. If you enjoy the content and want to support her work, consider joining The StarseedFX Community, where you will get daily market insights and trading alerts.
Share This Articles
Recent Articles
The GBP/NZD Magic Trick: How Genetic Algorithms Can Transform Your Forex Strategy
The British Pound-New Zealand Dollar: Genetic Algorithms and the Hidden Forces Shaping Currency Pairs
Chande Momentum Oscillator Hack for AUD/JPY
The Forgotten Momentum Trick That’s Quietly Dominating AUD/JPY Why Most Traders Miss the Signal
Bearish Market Hack HFT Firms Hope You’ll Never Learn
The One Bearish Market Hack High Frequency Traders Don't Want You to Know The
