
RSI Meets Cup and Handle: The Secret Sauce to Spotting Breakouts Before the Crowd
The Trading Pattern Nobody Talks About at Parties (But Should)
Imagine walking into a party and dropping, “So I was watching the RSI during a cup and handle formation yesterday…” Cue blank stares, someone awkwardly clutching a cheese cube, and one person Googling “cup and handle” under the table.
But here’s the twist: if you actually understand how to combine the Relative Strength Index (RSI) with the cup and handle pattern, you’re no longer just another trader. You’re the person who sees the champagne before the cork even pops.
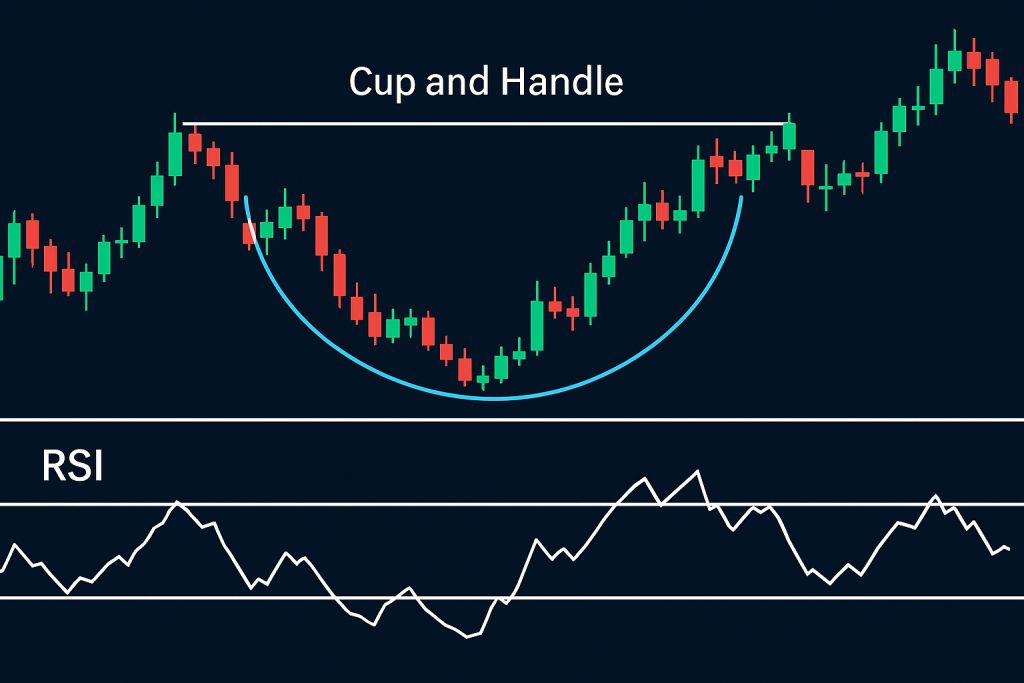
Cup and handle patterns are classic bullish continuation formations. Add RSI to the mix and you can detect when the handle is just a decoy—and the real breakout is about to moonwalk across your PnL.
Let’s spill the tea (and coffee, since this is a cup discussion).
The Real Reason Cup and Handle Traders Miss Breakouts
Most traders stare lovingly at the cup, but completely ignore the handle. That’s like dating someone for their jawline but ignoring that they only eat cereal with a fork.
The mistake? Not confirming the strength behind the setup.
That’s where RSI comes in. RSI helps you measure whether that breakout is backed by actual momentum or if it’s just another false signal dressed like a prom king.
Case in Point: According to a 2024 study from DailyFX, nearly 68% of failed breakout trades lacked momentum confirmation via indicators like RSI. That’s not just a statistic. That’s a neon warning sign.
RSI + Cup and Handle = Fireworks (If You Know When to Light the Fuse)
Here’s a step-by-step way to combine RSI with the cup and handle pattern like a trading sensei:
- Identify the Cup and Handle: Look for a rounded bottom (cup) followed by a short pullback (handle). Price should consolidate but hold above key support.
- RSI Timing Is Key: During the formation of the handle, RSI should dip but stay above 40. If RSI falls below 30, momentum might be too weak for a breakout.
- Look for RSI Divergence: If price is forming the handle while RSI forms higher lows, you’ve got a classic bullish divergence.
- Wait for RSI to Break Above 50-60 Zone: This confirms momentum is building. If RSI jumps above 60 before the breakout, you’re likely sitting on a ticking rocket.
- Breakout Candle + RSI > 60 = Go Time: When price breaks the handle’s resistance and RSI is above 60 (or even nearing 70), it’s game on.
Ninja-Level Tactics: What Most Traders Overlook
Enter the dojo, trader.
Here are a few secret techniques the pros use:
- Handle Trap Trick: If RSI doesn’t dip below 50 during the handle, it often signals institutional accumulation. They’re loading up.
- Volume RSI Combo: Overlay volume analysis. If volume increases as RSI crosses 60 and price breaks out, it’s not just a breakout—it’s a breakout with a crowd of whales behind it.
- Multi-Timeframe Confirmation: Check RSI on the higher timeframe (4H or Daily). If RSI is already bullish there too, the probability of a clean breakout doubles.
According to Kathy Lien, a Forex authority and managing director at BK Asset Management, “Momentum divergence during handle formations is often the strongest early signal. RSI becomes a spotlight that exposes whether big players are already in the game.”
Why Most RSI Traders Get It Wrong (And How You Can Flip the Script)
Many traders treat RSI like a buzzword. They see it hit 70 and scream, “Overbought! Time to short!” That’s like seeing a surfer catch a perfect wave and yelling at them to come back to shore.
Here’s what seasoned traders know:
- RSI over 70 isn’t a sell signal by default during a bullish continuation.
- It often means momentum is strong enough to sustain higher highs.
- In a cup and handle context, RSI above 70 post-breakout often precedes another leg up.
A 2023 study from TradingView found that cup and handle breakouts accompanied by RSI above 65 had a 71.4% success rate, compared to 42% when RSI was under 55.
The Secret Sauce: Hidden Cup and Handle Setups in Sideways Markets
Let’s go underground for a second.
Cup and handle patterns often go unnoticed during consolidation periods—the boring sideways grind where most traders snooze or overtrade themselves into a coma.
But this is where RSI becomes your night-vision goggles. Here’s what to look for:
- Sideways Cup with Gradual RSI Build-Up: Instead of a deep rounded bottom, watch for a shallow cup forming during low volatility periods. RSI slowly builds from 40 toward 60.
- Volume Drop During Handle: Low volume in the handle is GOOD. It means traders are hesitating. When RSI climbs quietly during this period, a surprise breakout becomes highly probable.
- Pre-FOMC Pattern Traps: These cup and handle setups form before big announcements (like FOMC or ECB). When the breakout aligns with a scheduled event and RSI surges, it creates a volatility-fueled launch.
As John Kicklighter from DailyFX notes, “The RSI acts as a volatility amplifier in pattern-based breakouts. It tells you when quiet setups are poised to explode.”
Cup, Handle, RSI… and the Smart Way to Trade It
If you’re looking to take this further, here’s your battle-tested checklist:
- Scan for cup and handle setups with clean symmetry.
- Confirm RSI doesn’t dip below 40 during the handle.
- Look for bullish divergence if RSI dips.
- Wait for RSI to cross 60 with volume rising.
- Confirm breakout candle closes above handle resistance.
- Place tight stops below the handle base and use trailing stop after breakout.
What You’ll Gain from This Strategy
- Elite Pattern Recognition using RSI as your trade confirmation weapon.
- Improved Entry Timing by syncing RSI momentum with breakout levels.
- Reduced False Breakouts by filtering patterns with weak RSI.
- Game-Changing Confidence knowing you’re trading with the momentum, not against it.
Still Guessing Your Way Through Chart Patterns? Time to Upgrade.
Want to trade like an insider? Get access to real-time alerts, economic indicators, and exclusive tools:
- Daily Economic News and Hidden Macro Clues
- Free Advanced Trading Courses
- Get Your Free Trading Plan
- Track It Like a Pro with Our Free Trading Journal
- Join the StarseedFX Community
- Optimize Lot Size with Our Smart Trading Tool
Image Credits: Cover image at the top is AI-generated
PLEASE NOTE: This is not trading advice. It is educational content. Markets are influenced by numerous factors, and their reactions can vary each time.

Anne Durrell & Mo
About the Author
Anne Durrell (aka Anne Abouzeid), a former teacher, has a unique talent for transforming complex Forex concepts into something easy, accessible, and even fun. With a blend of humor and in-depth market insight, Anne makes learning about Forex both enlightening and entertaining. She began her trading journey alongside her husband, Mohamed Abouzeid, and they have now been trading full-time for over 12 years.
Anne loves writing and sharing her expertise. For those new to trading, she provides a variety of free forex courses on StarseedFX. If you enjoy the content and want to support her work, consider joining The StarseedFX Community, where you will get daily market insights and trading alerts.
Share This Articles
Recent Articles
The GBP/NZD Magic Trick: How Genetic Algorithms Can Transform Your Forex Strategy
The British Pound-New Zealand Dollar: Genetic Algorithms and the Hidden Forces Shaping Currency Pairs
Chande Momentum Oscillator Hack for AUD/JPY
The Forgotten Momentum Trick That’s Quietly Dominating AUD/JPY Why Most Traders Miss the Signal
Bearish Market Hack HFT Firms Hope You’ll Never Learn
The One Bearish Market Hack High Frequency Traders Don't Want You to Know The
