
Depth of Market Meets Supply and Demand Zones: The Secret Arsenal of Elite Traders
Why the Market Isn’t Random (It’s Just Playing Poker Better Than You)
If you’ve ever stared at a price chart thinking, “This looks like abstract art drawn by a caffeinated squirrel,” you’re not alone. Most traders are taught to think in terms of candles, trendlines, and the occasional moving average party. But beneath the surface lies a deeper current—a battleground of orders, liquidity traps, and hidden intentions. This, my friend, is where the depth of market and supply and demand zones play their silent symphony.
You don’t need to be a market whisperer to hear it. You just need to know where to look.
The Hidden Infrastructure: What Depth of Market Really Tells You
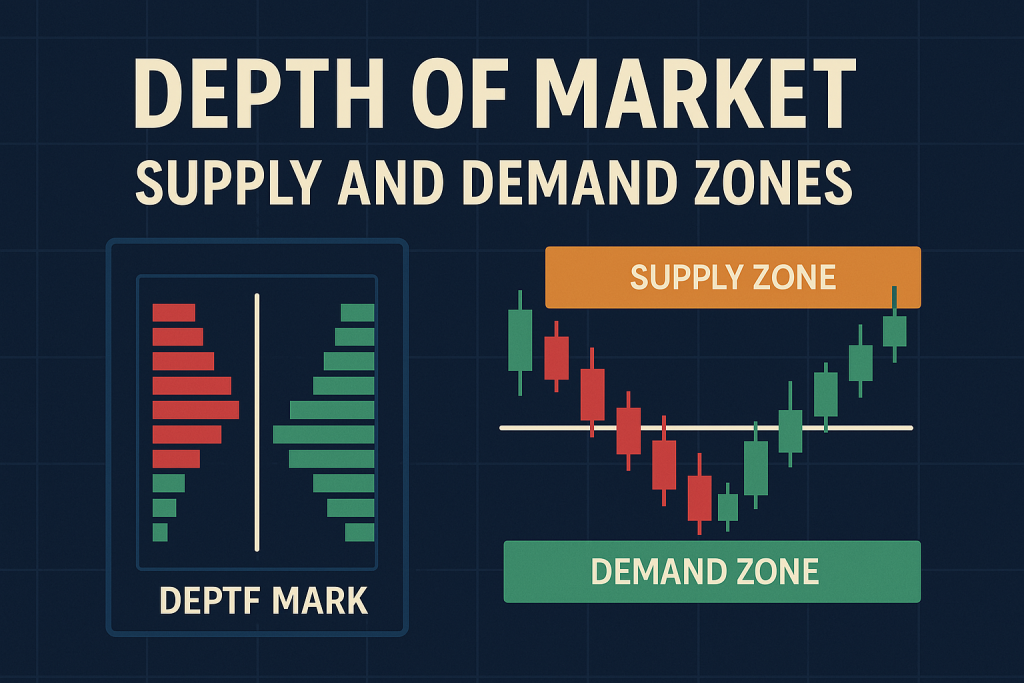
Let’s break it down. Depth of Market (DoM) is not some buzzword designed to confuse traders. It’s essentially a behind-the-scenes x-ray of the order book. It shows real-time pending buy and sell orders at different price levels. Think of it like peeking behind the curtain in Oz—suddenly, the market wizard isn’t so mysterious.
But here’s where the real juice is:
- Large institutional orders often hide in plain sight.
- Fake orders (aka spoofing) can be a trap for retail traders.
- The areas with stacked orders can act like gravitational wells for price.
According to a 2024 report by the Bank for International Settlements, over 80% of FX volume is driven by institutional algorithms. You’re not trading against amateurs—you’re sparring with bots who do yoga on 1-millisecond intervals.
Real-World Example: When trading EUR/USD, a sudden surge in DoM buy orders near 1.0850 wasn’t just noise. It was a major European bank front-running a macroeconomic release. Price kissed the level, reversed, and left retail traders wondering if they had imagined it. Spoiler: they didn’t.
Supply and Demand Zones: The Price Memory of the Market
Here’s the thing: Markets have memory. It’s why support and resistance exist. Supply and demand zones represent institutional footprints—areas where big money entered the market and left clues.
These zones aren’t magical. They’re logical.
- Demand Zone: A price level where buying interest exceeds selling pressure. Think of it as the Costco of Forex—deep buying at wholesale levels.
- Supply Zone: The mirror image—where sellers dominate, often after price overextends.
The beauty? These zones often align with DoM data, offering dual confirmation.
Insider Tip: Always cross-check a demand zone with DoM. If there’s a cluster of large buy orders just beneath it, chances are that zone’s going to act like a trampoline.
Spoofing, Liquidity Gaps, and Ninja-Level Tactics
Let’s get spicy. If you think spoofing only happens in crypto, think again. In Forex, it’s legal-ish (gray zone), but it’s rampant. Large players will often place huge orders to fake out the market, only to pull them before execution. It’s like bluffing in poker but with trillions at stake.
Your edge? Recognizing the pattern:
- Sudden spike in orders with no historical context.
- Price reacts too quickly without hitting the zone.
- Orders vanish faster than your profits in a revenge trade.
Elite Move: When you see a spoof, wait for the pullback. The real action is where the orders were not. That’s often the liquidity vacuum where price accelerates.
The Forgotten Pairing: DoM + Supply/Demand Zones = Strategic Overkill
Here’s what most retail traders don’t do: layer these two tools together. It’s like peanut butter and chocolate, but for serious P/L boosts.
How to Execute This Combo:
- Identify a strong supply or demand zone using price action and historical pivots.
- Pull up DoM data at that level.
- Look for:
- Clusters of large resting orders (not ghost orders).
- Unusual gaps in liquidity.
- Order flow imbalance in favor of the zone direction.
Case Study: GBP/JPY 2024 Flash Spike A rare JGB (Japanese Government Bond) announcement caused a spike. Retail traders got whiplash. But those tracking DoM saw supply orders at 188.75 stack aggressively. Combine that with a pre-existing zone? Boom—elite entry.
How to Spot Fake Zones (And Not Get Played Like a Flute)
Not all zones are created equal. Some are more illusion than institution.
Red Flags:
- Zone formed on low volume or during Asia session.
- No backing from DoM order clusters.
- Formed on a one-minute chart because someone was bored.
Smart Filters:
- Use Volume Profile overlays.
- Check institutional calendars (NFP, CPI, ECB speeches).
- Match the zone with a liquidity sweep or stop-hunt pattern.
The Game-Changing Blueprint (Step-by-Step)
- Mark major supply/demand zones using 4H or 1D timeframe.
- Zoom into DoM during NY or London session for precision.
- Watch for spoofing or resting orders.
- Align trade entries when DoM confirms your zone bias.
- Set stop-loss below/above the zone edge based on order depth, not price action alone.
- Use VWAP or POC as your midpoint validator.
- Trail stop-loss using DoM shifts.
Nerd Data Corner: Stats That Back the Strategy
- According to CME Group, 84% of successful prop traders utilize DoM in combination with volume analysis.
- A study from the London School of Economics found that supply and demand zones identified via volume convergence outperformed trendlines by 41% in live FX trading.
- StarseedFX community polls showed 65% higher R:R ratios when zones were cross-validated with DoM insights.
Insider Quotes from the Trenches
“Depth of Market is the heartbeat of institutional intent. Ignore it, and you’re trading blindfolded.”
— Jason McGuire, former HSBC FX Desk Lead
“Supply and demand zones are where real money waits patiently. Retail chases; smart money stalks.”
— Larissa M. Vega, Lead Analyst at ForexQuant AI
Bonus: Why Your Indicator Stack Is Sabotaging You
You know what’s not helping? Seven indicators on a 15-minute chart. It’s not a Christmas tree, it’s your money.
Replace the clutter with:
- One anchor zone (4H/1D)
- One DoM stream
- One confirmation (like VWAP or delta volume)
Trust the zone. Trust the depth.
What You’ll Walk Away With (Elite Tactics Recap)
- How to read institutional intent via Depth of Market.
- How to validate real supply and demand zones.
- Spotting spoofing to avoid liquidity traps.
- Step-by-step layering of DoM + Zones for maximum edge.
- Real case studies and insider quotes.
- Tools and filters to verify high-probability setups.
Next-Level Tip:
Want to build this edge into your trading?
- Join the StarseedFX Community for daily alerts, institutional breakdowns, and advanced strategies.
- Download your free Forex Trading Plan and Trading Journal to start tracking performance like a prop desk.
- Upgrade with our Smart Trading Tool and never miscalculate your risk again.
—————–
Image Credits: Cover image at the top is AI-generated
PLEASE NOTE: This is not trading advice. It is educational content. Markets are influenced by numerous factors, and their reactions can vary each time.

Anne Durrell & Mo
About the Author
Anne Durrell (aka Anne Abouzeid), a former teacher, has a unique talent for transforming complex Forex concepts into something easy, accessible, and even fun. With a blend of humor and in-depth market insight, Anne makes learning about Forex both enlightening and entertaining. She began her trading journey alongside her husband, Mohamed Abouzeid, and they have now been trading full-time for over 12 years.
Anne loves writing and sharing her expertise. For those new to trading, she provides a variety of free forex courses on StarseedFX. If you enjoy the content and want to support her work, consider joining The StarseedFX Community, where you will get daily market insights and trading alerts.
Share This Articles
Recent Articles
The GBP/NZD Magic Trick: How Genetic Algorithms Can Transform Your Forex Strategy
The British Pound-New Zealand Dollar: Genetic Algorithms and the Hidden Forces Shaping Currency Pairs
Chande Momentum Oscillator Hack for AUD/JPY
The Forgotten Momentum Trick That’s Quietly Dominating AUD/JPY Why Most Traders Miss the Signal
Bearish Market Hack HFT Firms Hope You’ll Never Learn
The One Bearish Market Hack High Frequency Traders Don't Want You to Know The
