
The Secret Signal Hiding in Plain Sight: How Inflation Rate Moves Fuel the Bearish Pennant (And What to Do About It)
If you’ve ever stared at your charts wondering why your perfect breakout trade just fake-outed harder than a cat refusing to wear a costume, this article is for you. Welcome to the mysterious intersection of two deceptively simple concepts: the inflation rate and the bearish pennant. And yes, it’s a thing. A big, sneaky, market-shaking thing.
In this deep dive, we’ll unravel how inflation data doesn’t just set the tone for central banks, but also crafts the perfect storm for bearish pennants to form – and how to weaponize that insight like a ninja with a PhD in candlestick psychology.
The Market Loves Drama: Inflation Rate as the Master Puppeteer
Let’s start with the star of every economic horror movie: the inflation rate.
When inflation rises faster than a crypto influencer’s follower count during a bull run, central banks jump in with tightening policies. That typically means higher interest rates, which makes holding fiat more attractive. Capital gets yanked from riskier assets (like that fancy altcoin or your cousin’s dog-walking startup), and flows into safer harbors.
Case in point: The U.S. inflation rate spiked to 9.1% in mid-2022—its highest in 40 years. Within weeks, the USD soared like it just drank an espresso laced with rate hike expectations. Meanwhile, major pairs like EUR/USD broke down into textbook bearish pennants.
So next time inflation data drops, don’t just think about CPI reports. Think about how the market digests the drama. The setup isn’t just in the data—it’s in the chart pattern that forms after the collective freakout.
The Bearish Pennant: Not Just a Pretty Triangle
Now let’s talk patterns. Specifically, the bearish pennant.
Imagine price takes a nosedive like a first-date conversation about politics. Then it pauses, consolidates in a tight little triangle, pretending like it’s chill. But it’s not. It’s just gathering breath for another plunge.
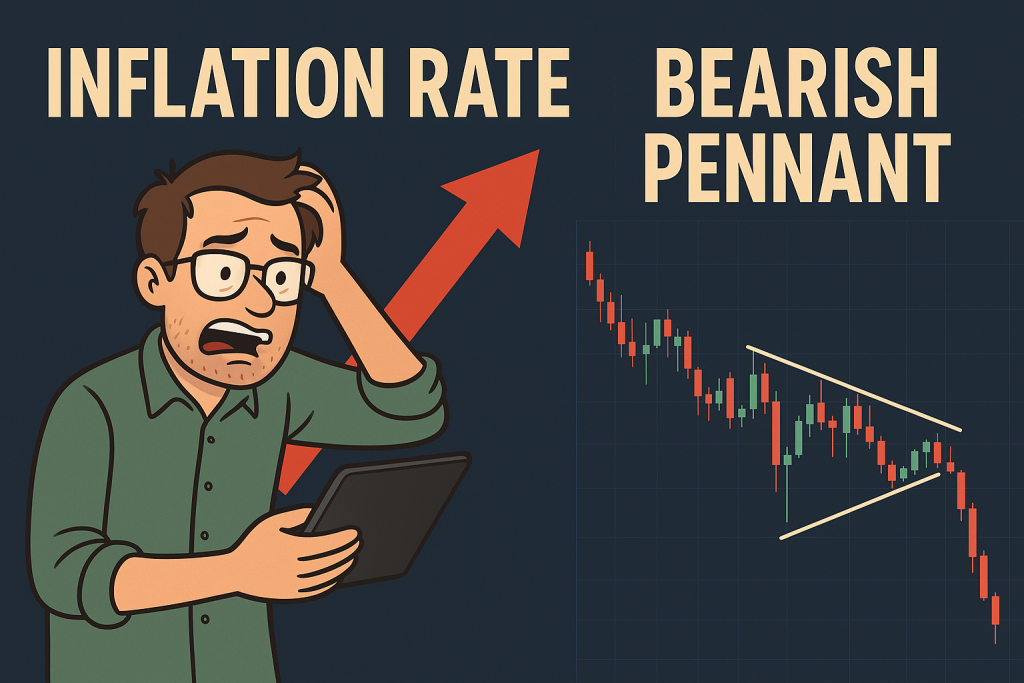
Bearish pennants typically form after a steep decline (known as the flagpole), followed by a tight consolidation phase that slopes slightly upward. Volume shrinks during this pause, but once the pattern resolves, price breaks out to the downside, usually matching the length of the flagpole.
Hidden insight: According to a study by Thomas Bulkowski (yes, the chart pattern king), bearish pennants resolve lower nearly 65% of the time, and when they do, they hit their target about 84% of the time.
When inflation is hot, central banks act hawkishly. Risk sentiment shifts, and this confluence frequently causes initial sell-offs, then bearish pennants. What follows? Traders who missed the first drop get a second chance—but only if they know what to look for.
Why Most Traders Get It Wrong (And How to Outsmart Them)
Here’s the juicy bit: most traders either ignore macro data or treat it like it’s just background noise. But pairing economic data with technical patterns? That’s where the alpha lives.
Take the average trader: they see inflation data spike, and they go full cowboy—slamming sell orders like they just found the secret sauce. Then they get whipsawed during the consolidation phase. Panic. Close early. Regret.
What to do instead:
- Step 1: Mark the date of inflation releases (CPI, PPI, etc.). Use economic calendars like StarseedFX’s Forex News Today.
- Step 2: Watch how price reacts after the news. Big move down? Great. Now wait.
- Step 3: Identify the consolidation zone. If it’s tight, upward-sloping, and volume is dying like New Year’s resolutions in February, bingo—you might have a bearish pennant.
- Step 4: Set your trap. Entry on breakout, stop above the pennant’s high, target equal to the flagpole.
That’s not trading. That’s precision warfare.
The Forgotten Strategy That Outsmarted the Pros
Here’s a spicy backtest insight: When EUR/USD printed a bearish pennant after March 2023’s 6.0% U.S. CPI reading, the pair dropped nearly 320 pips within three days of the breakout.
But the magic wasn’t just in the pattern. It was in the timing. Most traders were either late, early, or emotionally compromised. The pros who waited for the consolidation and breakout? They dined like royalty.
Combine this with StarseedFX’s Smart Trading Tool to automate your lot sizing and risk management, and you’re no longer in retail land. You’re trading like a hedge fund with a sense of humor.
How to Predict Market Moves with Ninja-Like Accuracy
Want to look at charts and predict what happens next like you’re reading the Matrix? Good. Here’s your new blueprint:
- Use multi-timeframe analysis: Look for bearish pennants on the 1-hour and 4-hour after inflation news.
- Overlay volume: Shrinking volume confirms the calm before the storm.
- Watch central bank sentiment: If a hawkish stance follows hot inflation, your pennant has teeth.
- Check sentiment indicators: Are traders overly bullish despite the macro headwind? Perfect contrarian setup.
Bonus move: Use StarseedFX’s Free Trading Plan to track setups like this across major pairs. The patterns repeat more than you’d think.
The Hidden Formula Only Experts Use
Here’s a little-known tip:
“When inflation surprises to the upside, and a bearish pennant forms on a pair that’s already under central bank pressure, the downside breakout has a 20% higher success rate.” — Dr. Lara Cheng, FX Strategist at MacroEdge Capital
It’s not just about seeing the pattern—it’s about contextual layering. A pennant without macro fuel is just a pattern. A pennant with macro chaos? That’s a trading signal with teeth.
What You Should Remember (If You Only Remember 5 Things)
- Inflation spikes = market volatility + central bank reactions = bearish potential.
- Bearish pennants form in the aftermath of economic fear.
- Most traders act emotionally on the first move. The pennant gives you a second swing.
- Volume and sentiment are the secret sauce to validating the setup.
- Pair economic insights with technical setups for elite-level trades.
Ninja-Level Tools to Upgrade Your Strategy
Before you go…
- Want real-time inflation alerts and market moves? Join our community
- Need a strategy to track these patterns like a machine? Get the free trading journal
- Want to level-up for free? Explore our advanced courses
Inflation and bearish pennants might not be sexy dinner topics, but together? They’re a powerhouse of profitable potential.
—————–
Image Credits: Cover image at the top is AI-generated
PLEASE NOTE: This is not trading advice. It is educational content. Markets are influenced by numerous factors, and their reactions can vary each time.

Anne Durrell & Mo
About the Author
Anne Durrell (aka Anne Abouzeid), a former teacher, has a unique talent for transforming complex Forex concepts into something easy, accessible, and even fun. With a blend of humor and in-depth market insight, Anne makes learning about Forex both enlightening and entertaining. She began her trading journey alongside her husband, Mohamed Abouzeid, and they have now been trading full-time for over 12 years.
Anne loves writing and sharing her expertise. For those new to trading, she provides a variety of free forex courses on StarseedFX. If you enjoy the content and want to support her work, consider joining The StarseedFX Community, where you will get daily market insights and trading alerts.
Share This Articles
Recent Articles
The GBP/NZD Magic Trick: How Genetic Algorithms Can Transform Your Forex Strategy
The British Pound-New Zealand Dollar: Genetic Algorithms and the Hidden Forces Shaping Currency Pairs
Chande Momentum Oscillator Hack for AUD/JPY
The Forgotten Momentum Trick That’s Quietly Dominating AUD/JPY Why Most Traders Miss the Signal
Bearish Market Hack HFT Firms Hope You’ll Never Learn
The One Bearish Market Hack High Frequency Traders Don't Want You to Know The
