
The Square of 9 + Yearly Strategy: The Hidden Market Map Every Trader Should Know
The Tool That Sounds Like a Math Quiz But Acts Like a Market GPS
If you’ve ever heard someone say “Square of 9” and thought, Is that a calculator, a yoga pose, or the password to a trading cult? — congratulations, you’ve just uncovered one of the best-kept secrets in technical analysis.
Now layer it with the concept of the yearly cycle, and what do you get? A cosmic cheat code to decode long-term market rotations that most traders will never see. This article pulls back the curtain on the little-known but powerful combination of the Square of 9 and yearly timing techniques—perfect for the ninja-level trader ready to go from playing checkers to interdimensional chess.
The Hidden Formula Only Experts Use
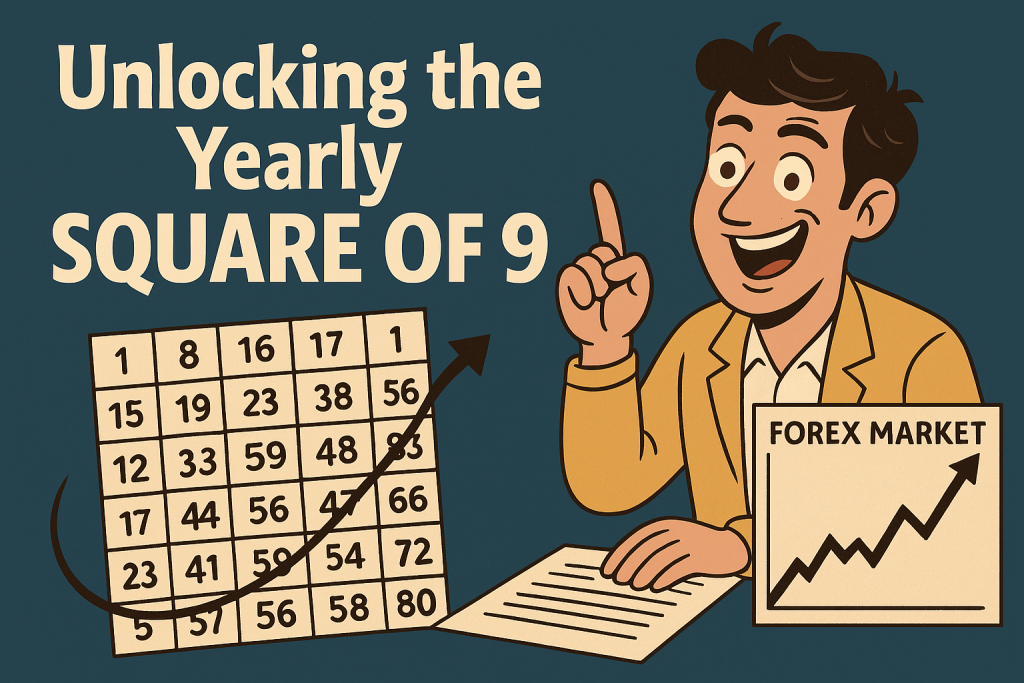
The Square of 9 (also called the Gann Wheel) is an ancient geometric spiral tool used to forecast market turning points. No, it doesn’t come with a wand or Hogwarts certificate, but it might as well. Originally developed by W.D. Gann, this tool helps identify key price levels and time cycles using the square root of numbers rotated on a spiral.
Here’s where it gets juicy: by applying this spiral to yearly cycles, traders can forecast major turning points months in advance.
Imagine knowing where resistance will likely sit based on price geometry and time symmetry—and it works better than a crystal ball after two espressos.
“When time and price square out, change is inevitable.” — W.D. Gann
The Core Concept
- Price levels plotted on a spiral grid create natural resistance and support zones.
- When a price “squares out” with time (example: 144 days after a major swing), the market tends to pivot.
- Combine this with yearly seasonality, and you unlock hyper-accurate windows of opportunity.
Why Most Traders Get It Wrong (And How You Can Avoid It)
Many traders treat yearly cycles like horoscopes—vague and not actionable. But here’s the myth-busting truth: seasonal tendencies are real, and when mapped to the Square of 9, they become absurdly accurate.
Take the EUR/USD pair, for example. Historical analysis shows that it often makes significant moves around mid-May and late October. Coincidence? Nope. These align with Gann’s key 90- and 180-degree time cycles off the yearly open.
Common Mistake #1: Ignoring time as a market variable.
- If you focus solely on price, you’re bringing a spoon to a sword fight.
Common Mistake #2: Misapplying the tool.
- The Square of 9 isn’t plug-and-play. You must align it with the yearly open price to find relevant time/price harmonics.
Here’s how to do it right:
- Take the yearly opening price of the asset.
- Find its square root.
- Add or subtract 1.0 (or 0.25, 0.5, 0.75 depending on cycle angles).
- Square the result to get price targets.
- Map time using key angle dates (90, 180, 270, 360 days from Jan 1).
Voilà. You now have both time and price squared. Magic? No. Math? Yes. But the cool kind.
The Forgotten Strategy That Outsmarted the Pros
Remember the 2022 Gold run-up? It wasn’t just macro-driven. When you overlay the yearly opening price of XAU/USD on the Square of 9 and track 90-degree dates, you’ll notice something eerie:
- 90 degrees from Jan 1: Gold reversed sharply (April 1-2).
- 180 degrees: A bottom was formed (early July).
- 270 degrees: A new rally kicked off (early October).
This isn’t retroactive fortune-telling. It’s geometry-meets-astrology-with-a-dash-of-wall-street.
According to Larry Pesavento, a Gann technique expert: “When time and price align, a reaction is almost guaranteed. The Square of 9 isn’t magic; it’s math applied rhythmically.”
How to Predict Market Moves with Precision
Ready for the real meat? Here’s how to use this strategy for your yearly forecasts:
Step-by-Step Guide to Applying the Square of 9 to Yearly Cycles:
- Start with the Yearly Open Price
- Example: EUR/USD opens at 1.1000 on Jan 1
- Calculate the Square Root
- sqrt(1.1000) = 1.0488
- Add Angular Values
- Add 0.25 (90 deg), 0.5 (180 deg), 0.75 (270 deg), 1.0 (360 deg)
- Square the Result
- 1.0488 + 0.25 = 1.2988 -> squared = ~1.687
- These become potential resistance or support zones
- Match With Time Intervals
- Add 90/180/270/360 days to Jan 1
- Look for these dates as potential pivot zones
Game-Changing Tip:
Use these levels in combination with volume profile or institutional order flow for confirmation.
Underground Tactics No One Talks About
Most platforms don’t include the Square of 9 in their charting packages. Here’s a workaround:
- Use Excel or custom scripts to create your Square of 9 chart.
- Integrate with economic calendars to correlate with high-impact events.
- Backtest major assets (especially majors like EUR/USD, USD/JPY, GBP/CHF) over the past 5-10 years.
Elite Combo: Overlay the Square of 9 on yearly chart data alongside macroeconomic indicators like CPI, NFP, and Retail Sales. This is where the StarseedFX community gets tactical.
Real-World Applications: Case Studies That Prove It Works
Case Study 1: GBP/JPY 2023
- Yearly Open: 157.20
- 180 degrees = July 1
- Price aligned with a key Square of 9 resistance level (~163.90)
- GBP/JPY reversed sharply for a 350+ pip move
Case Study 2: USD/CAD 2021
- Yearly Open: 1.2750
- 270-degree cycle = Late September
- Market topped precisely at a Square of 9 level and dropped over 400 pips in two weeks
As Forex analyst Bo Yoder put it: “Gann’s tools, like the Square of 9, aren’t meant to predict—they’re meant to prepare
The One Simple Trick That Can Change Your Trading Mindset
Start seeing time as cyclical, not linear. Markets aren’t Netflix episodes—they loop, rotate, and echo. The Square of 9 helps you see the market’s geometry like Neo looking at the Matrix.
And hey, if your last trade felt like getting socks for your birthday, it might be time to square out your thinking. Literally.
Get the Edge with StarseedFX (Because You Deserve More Than Mediocre Charts)
Ready to go deeper?
- Discover real-time updates and exclusive economic reports at Forex News Today
- Master rare strategies with Free Forex Courses
- Join a tribe of elite traders at StarseedFX Community
- Get a head start with our Free Trading Plan
- Track your mastery with the Free Trading Journal
- Supercharge execution with our Smart Trading Tool
What You’ll Walk Away With
- An advanced understanding of the Square of 9
- How to fuse it with yearly cycles for high-probability trades
- Steps to calculate precise support/resistance using angular math
- Real-world case studies and data-backed examples
- A new way of looking at time (and probably life, but that’s a bonus)
—————–
Image Credits: Cover image at the top is AI-generated
PLEASE NOTE: This is not trading advice. It is educational content. Markets are influenced by numerous factors, and their reactions can vary each time.

Anne Durrell & Mo
About the Author
Anne Durrell (aka Anne Abouzeid), a former teacher, has a unique talent for transforming complex Forex concepts into something easy, accessible, and even fun. With a blend of humor and in-depth market insight, Anne makes learning about Forex both enlightening and entertaining. She began her trading journey alongside her husband, Mohamed Abouzeid, and they have now been trading full-time for over 12 years.
Anne loves writing and sharing her expertise. For those new to trading, she provides a variety of free forex courses on StarseedFX. If you enjoy the content and want to support her work, consider joining The StarseedFX Community, where you will get daily market insights and trading alerts.
Share This Articles
Recent Articles
The GBP/NZD Magic Trick: How Genetic Algorithms Can Transform Your Forex Strategy
The British Pound-New Zealand Dollar: Genetic Algorithms and the Hidden Forces Shaping Currency Pairs
Chande Momentum Oscillator Hack for AUD/JPY
The Forgotten Momentum Trick That’s Quietly Dominating AUD/JPY Why Most Traders Miss the Signal
Bearish Market Hack HFT Firms Hope You’ll Never Learn
The One Bearish Market Hack High Frequency Traders Don't Want You to Know The
