
The Volume Profile Playbook: How Retail Sales Quietly Signal Market Giants
Why Your Charts Might Be Lying to You (And How to Hear the Market Whisper Instead)
Imagine analyzing the market using only candlesticks and MACD… it’s kind of like trying to predict traffic patterns with a compass and a magic 8-ball. You’re looking in the right general direction, but let’s be honest—you’re missing what the whales see.
Enter: the Volume Profile, a trader’s sonar system for spotting hidden liquidity zones.
Now combine that with retail sales data, the most underestimated macroeconomic stat that sneaks past 90% of retail traders (pun fully intended). Together, this duo forms a sniper rifle in a world full of shotguns.
Let’s break down how this combo reveals underground trends, exposes institutional footprints, and serves as your personal BS detector when the market starts throwing tantrums.
Volume Profile: Your Market X-Ray Goggles
Most traders focus on price like it’s the star of the show. But here’s the dirty little secret: price is just the invitation. Volume is the RSVP list. And if you’re not watching who’s showing up, you’re basically trading at a masquerade party blindfolded.
Volume profile tells you:
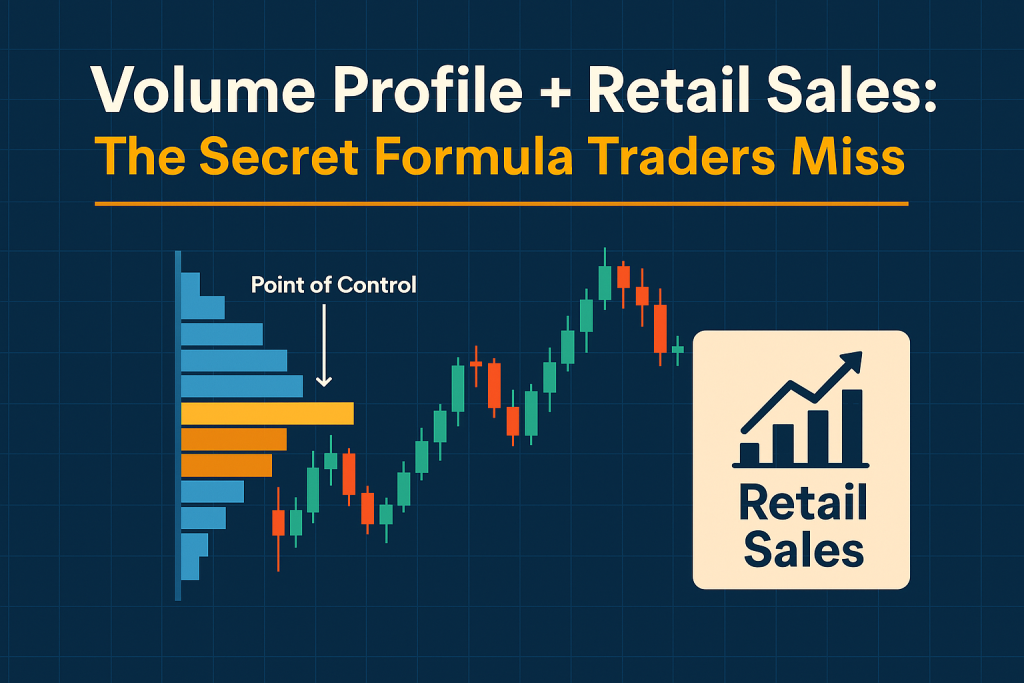
Where the market has accepted value (the Point of Control or POC)
Where price has been rejected (low volume nodes)
Where big players load up while everyone else is panicking (hint: not where you think)
???? Insider Tip: Institutional traders often build positions at high-volume nodes. Think of it as the quiet bar where deals are made, while retail traders chase shadows at loud, trendy price extremes.
“Volume reveals the truth. Price is just marketing.” – Anna Coulling, author of A Complete Guide to Volume Price Analysis
Now, what happens when we pair this X-ray with a crystal ball? That’s where retail sales step in.
Retail Sales: The Hidden Pulse of Market Sentiment
If GDP is the economic novel, retail sales are the tweet that triggers the market’s mood swings. It’s fast, emotional, and everyone from Wall Street analysts to Forex bots takes note.
But here’s the kicker most traders miss: it’s not just the headline number that matters. It’s how that number interacts with volume profile zones that makes the magic happen.
Let’s say U.S. retail sales print above expectations—cue the crowd screaming “USD to the moon!” But here’s what elite traders ask:
Is price already at a high-volume node (HVN)? Likely to stall or reverse.
Is price approaching a low-volume area (LVN)? Could blast through like a hot knife through liquidity butter.
Did this data align with a recent volume shelf that institutions defended last month? That’s your sniper-level entry.
???? Example (2024 Q4): After U.S. November retail sales surprised to the upside, USD/JPY surged—but only held above 148.00 because it aligned with a previous high-volume node from the July consolidation range. The price literally respected the POC like it owed it rent.
The Unholy Grail: Combining Volume Profile with Retail Sales Events
Let’s talk strategy. This is where the rubber meets the Fibonacci.
Here’s your 5-step sniper setup:
???? 1. Identify High-Impact Retail Sales Reports
Use the economic calendar to track major releases—U.S., UK, Canada, Australia. Focus on surprise potential. Boring forecasts = weak reactions.
???? 2. Load Your Volume Profile Tool (Not Just Volume Bars)
Platforms like TradingView or Sierra Chart allow custom volume profile analysis by session, day, or custom range. Target the last 1-2 months or recent consolidation zones.
???? 3. Look for Confluence Zones
These are areas where:
Recent price action aligns with HVN or LVN
Prior retail sales reports triggered reactions
Price stalled or reversed before
???? 4. Prep Entries Based on Retail Sales Print
Strong retail sales + price at LVN → Likely breakout
Weak retail sales + price at HVN → Rejection or reversal
Surprise numbers + past POC → Hidden institutional setups
???? 5. Use Smart Order Management
Leverage StarseedFX’s Smart Trading Tool to:
Auto-calculate your lot sizes based on risk
Set stop-loss just beyond the volume shelf
Place take profit just before next HVN
Bonus Tip: If price blasts through an LVN post-news, it often retests it before continuation. That’s your retest entry—low risk, high confidence.
Why Most Traders Miss This (And You Won’t Anymore)
Let’s be honest. Most traders treat retail sales like a “meh” stat. But that’s like ignoring a fire alarm because it’s annoying. Here’s the truth bomb:
“Retail sales are one of the best leading indicators for short-term consumer confidence. And where consumers go, markets follow.” — Marc Chandler, Chief Market Strategist, Bannockburn Global Forex
And while they chase candlestick formations on 5-minute charts, you’re:
Tracking institutional footprints
Syncing macro data with volume-defined levels
Dodging fakeouts like a trader with Matrix-level reflexes
Case Study: EUR/USD Retail Sales Reversal (January 2025)
???? Event: Eurozone retail sales came in -0.8% vs forecast -0.3%
???? Initial Reaction: EUR/USD dropped from 1.0920 to 1.0850 within 30 minutes
???? Volume Profile Insight: 1.0850 was a prior HVN from December’s POC
???? Result: Price bounced, retraced 80% of the move, trapping breakout sellers.
???? Takeaway: A bad headline isn’t enough. Volume zones are the context. Without it, you’re trading the news like a tabloid reader, not a portfolio tactician.
Underground Trends: What the Pros Are Whispering
Let’s peel the curtain and show what’s trending behind closed prop firm doors:
Volume Imbalance Bots: Algorithmic tools that scan for mismatches in buy/sell pressure at volume nodes.
Retail Sales + Consumer Credit Combo: When both data points show divergence, it’s often a signal for a larger correction.
VRN (Volume Reversion Node) Zones: Pro traders now track mean reversion patterns at specific POCs triggered by macro events—especially retail numbers.
Elite Trader Playbook: What You’ve Learned
✅ How to use Volume Profile like a seasoned prop trader
✅ Why Retail Sales data is your secret macro timing weapon
✅ How to combine both into sniper-level entries
✅ Real-world examples and expert-backed strategies
✅ Exclusive tactics to detect fakeouts and follow institutional footprints
Want More Tools Like This?
???? Get daily institutional insights at our Forex News Hub
???? Master volume + macro strategies in our Free Courses
???? Join our elite Trading Community for alerts, setups, and live mentorship
???? Refine your edge with our Free Trading Journal & Free Trading Plan
Let’s Wrap It with a Bowtie (Because Why Not?)
Trading isn’t about reacting faster—it’s about reading deeper. Candles scream. Indicators echo. But volume profile and retail sales? They whisper. And the trader who listens… gets the edge.
—————–
Image Credits: Cover image at the top is AI-generated
PLEASE NOTE: This is not trading advice. It is educational content. Markets are influenced by numerous factors, and their reactions can vary each time.

Anne Durrell & Mo
About the Author
Anne Durrell (aka Anne Abouzeid), a former teacher, has a unique talent for transforming complex Forex concepts into something easy, accessible, and even fun. With a blend of humor and in-depth market insight, Anne makes learning about Forex both enlightening and entertaining. She began her trading journey alongside her husband, Mohamed Abouzeid, and they have now been trading full-time for over 12 years.
Anne loves writing and sharing her expertise. For those new to trading, she provides a variety of free forex courses on StarseedFX. If you enjoy the content and want to support her work, consider joining The StarseedFX Community, where you will get daily market insights and trading alerts.
Share This Articles
Recent Articles
The GBP/NZD Magic Trick: How Genetic Algorithms Can Transform Your Forex Strategy
The British Pound-New Zealand Dollar: Genetic Algorithms and the Hidden Forces Shaping Currency Pairs
Chande Momentum Oscillator Hack for AUD/JPY
The Forgotten Momentum Trick That’s Quietly Dominating AUD/JPY Why Most Traders Miss the Signal
Bearish Market Hack HFT Firms Hope You’ll Never Learn
The One Bearish Market Hack High Frequency Traders Don't Want You to Know The
