
When Liquidity Meets the Pennant: A Bear Trap in Disguise
Picture this: You walk into a store, everything’s on sale, and the aisles are packed with shoppers. You feel good. It’s liquid. It’s bustling. You see a flashy jacket (a.k.a. a “bullish breakout”), but just as you’re about to buy, someone yells, “Wait! That’s last season’s stock!”—and boom, you’re in the middle of a bearish pennant disguised as a clearance rack. Welcome to the liquid market illusion.
But here’s where things get spicy. While most traders are busy misreading the signs, you’re going to learn how to spot the bearish pennant pattern in a liquid market like a seasoned ninja in a crowd of clumsy samurais.
Let’s unlock the secrets.
The Liquidity Mirage: Why Volume Doesn’t Always Mean Safety
A liquid market means there’s a high level of trading activity—buyers and sellers exchanging positions faster than a toddler changes interests. Think major pairs like EUR/USD or GBP/JPY. But here’s the catch:
“Liquidity is a double-edged sword. It offers tight spreads—but it also hides predators.”
— John Kicklighter, Chief Strategist at DailyFX
Many traders assume high liquidity equals predictability. Spoiler: It doesn’t. In fact, during consolidation phases—when traders are most relaxed—is exactly when institutions start setting traps.
Enter: the bearish pennant.
The Bearish Pennant: The Fancy Name for ‘Calm Before the Smackdown’
Imagine the market just had a panic drop (like someone discovering their avocado toast cost $17). That sharp decline? That’s your flagpole.
Then things calm down. A neat little triangle forms. Traders start thinking, “Hey, maybe this was the bottom.” And just as they start buying in—wham!—the next leg down kicks in like a bad sequel to an already terrible movie.
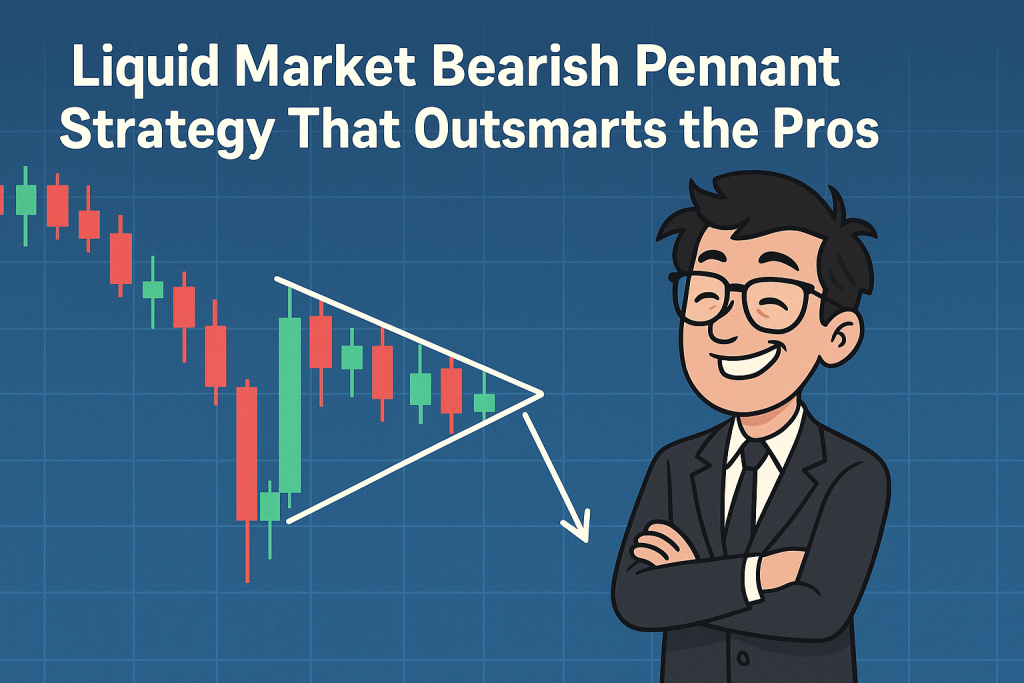
What It Looks Like:
Sharp downward move (flagpole)
Brief consolidation phase with converging trendlines
Continuation breakdown in the same direction (southbound)
Key Stats:
A 2023 report by IG Group found that over 72% of bearish pennants in high-volume currencies resulted in continuation within 4–6 candles post-breakout.
According to Investopedia, breakout traders mistime bearish pennants over 40% of the time—usually by buying too early during consolidation.
The Secret Sauce: How Liquid Markets Hide the Real Breakdown
Liquid markets give a false sense of stability. The spread is tight, slippage is low, and volume is high—but that doesn’t mean sentiment is bullish. It just means there are enough traders to fool.
Here’s what most traders miss:
Liquidity attracts fake breakouts.
Institutions use this liquidity to unload positions discreetly.
The consolidation in the pennant is often a “distribution zone” dressed up as indecision.
“In liquid markets, smart money doesn’t fight. It disguises.”
— Linda Raschke, Veteran Trader & Author of Street Smarts
How to Outsmart the Trap: Ninja Tactics for Real Traders
Let’s break it down. You don’t need a PhD in candlestick sociology—just precision, patience, and pattern awareness.
✅ Step-by-Step: Spotting the Bearish Pennant in a Liquid Market
Scan for Sharp Downtrend
Look for a high-volume, impulsive bearish candle. This is your flagpole, often caused by economic data releases or geopolitical shocks.Identify the Pennant Structure
Look for converging trendlines (not horizontal like a rectangle) forming a triangle. Bonus points if it’s happening at a support level that everyone’s watching.Measure Volume
During the consolidation, volume should dry up—if not, it might be a fakeout. The real drop usually comes after volume spikes again with the breakout.Wait for Confirmation
Don’t front-run the pattern. Let the price close below the pennant’s lower trendline on increased volume.Set Entry, Stop, and Target
Entry: After confirmation close below pennant
Stop Loss: Just above the upper trendline of the pennant
Target: Length of the flagpole projected downward
The Forgotten Blueprint: Case Study from the GBP/USD Breakdown
Let’s revisit July 2023. GBP/USD had a sharp 120-pip sell-off post-BoE rate indecision. What followed?
A textbook bearish pennant.
While retail traders got excited about the “recovery” and started longing the consolidation phase, institutions were offloading their short positions like they were dumping old crypto wallets.
???? The result? A 150-pip dump post-breakout, hitting stops and dreams equally hard.
Why Most Traders Get This Wrong (And How You Won’t)
Myth: Liquidity = Stability
Truth: Liquidity = Opportunity (for both sides)Myth: Pennants Signal Reversals
Truth: They’re continuation patterns—bearish pennants especially scream “we’re not done falling yet!”Myth: Breakouts Always Boom Instantly
Truth: Smart traders wait for post-breakout confirmation. Entering early = inviting pain.
The Invisible Hand: Institutional Order Flow & The Pennant Setup
Institutions love liquid markets because they can:
Enter large orders without moving the price (too much)
Use patterns like the bearish pennant to attract liquidity
Trigger retail stops with deceptive “fake-outs”
Insider Tip:
Use tools like the Smart Trading Tool from StarseedFX to analyze order flow behavior and confirm momentum before pulling the trigger.
The Trader’s Cheat Sheet: Bearish Pennant Checklist
Before entering your next trade, run this mental checklist:
✅ Is there a strong bearish flagpole preceding the consolidation?
✅ Are the trendlines converging (not horizontal)?
✅ Is volume declining during the pennant?
✅ Is the breakout confirmed with volume and a candle close?
✅ Did you avoid buying into the consolidation?
If you checked 5/5—congrats, Sensei. You just side-stepped a trap like a true forex samurai.
Insider Tools to Level Up
Looking to dodge more traps and unlock real alpha?
Stay updated with institutional flows: Forex News Today
Get elite tactics and live trading insights: StarseedFX Community
Craft sniper-grade strategies: Free Trading Plan
Refine your edge with real metrics: Free Trading Journal
Final Thoughts: Pattern, Patience, and Precision
The bearish pennant in a liquid market is one of the most deceptive setups you’ll encounter. It’s like a “Free Samples” sign outside a haunted house—you will be lured in unless you know the structure.
But now? You do.
Use this knowledge like a scalpel. Cut through the noise. And when the next pennant forms on your chart? Smile. Because the setup isn’t trapping you anymore—you’re trapping it.
???? Elite Takeaways Recap
Bearish pennants are continuation patterns, not reversal signs.
Liquid markets hide traps behind tight spreads and high activity.
Smart traders wait for volume confirmation before entry.
Institutions love liquidity—because they can execute traps cleanly.
Use a defined entry/stop/target system to avoid emotional trades.
—————–
Image Credits: Cover image at the top is AI-generated
PLEASE NOTE: This is not trading advice. It is educational content. Markets are influenced by numerous factors, and their reactions can vary each time.

Anne Durrell & Mo
About the Author
Anne Durrell (aka Anne Abouzeid), a former teacher, has a unique talent for transforming complex Forex concepts into something easy, accessible, and even fun. With a blend of humor and in-depth market insight, Anne makes learning about Forex both enlightening and entertaining. She began her trading journey alongside her husband, Mohamed Abouzeid, and they have now been trading full-time for over 12 years.
Anne loves writing and sharing her expertise. For those new to trading, she provides a variety of free forex courses on StarseedFX. If you enjoy the content and want to support her work, consider joining The StarseedFX Community, where you will get daily market insights and trading alerts.
Share This Articles
Recent Articles
The GBP/NZD Magic Trick: How Genetic Algorithms Can Transform Your Forex Strategy
The British Pound-New Zealand Dollar: Genetic Algorithms and the Hidden Forces Shaping Currency Pairs
Chande Momentum Oscillator Hack for AUD/JPY
The Forgotten Momentum Trick That’s Quietly Dominating AUD/JPY Why Most Traders Miss the Signal
Bearish Market Hack HFT Firms Hope You’ll Never Learn
The One Bearish Market Hack High Frequency Traders Don't Want You to Know The
