
The Hidden Expansion Phase Secret Behind Every Bullish Flag Breakout
Imagine you’re assembling IKEA furniture. The instructions say, “Just follow these 4 simple steps.” Four hours, one identity crisis, and a missing screw later—you realize the instructions lied.
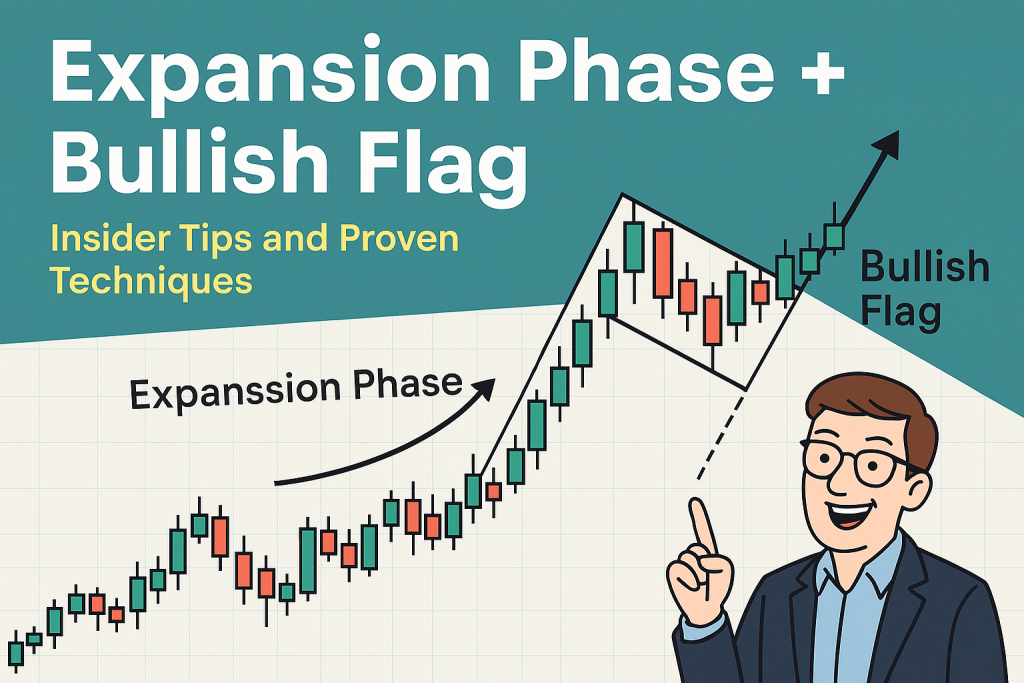
Trading during the expansion phase of a bullish flag? Pretty much the same. Everyone talks about the flag, but nobody mentions the crucial moment that actually drives the breakout—the expansion phase.
Yet here’s the twist: if you can master this phase, you can catch explosive moves while most traders are still fumbling with Allen wrenches and broken trendlines.
The Setup Traders Keep Getting Wrong
Let’s call it what it is: traders love patterns. Flags, pennants, head-and-shoulders—if it vaguely resembles geometry, someone’s drawing trendlines on it. But here’s the thing:
Most traders chase bullish flag breakouts without understanding the expansion phase that makes them valid.
The bullish flag is a continuation pattern that consolidates after a strong upward move. But the magic doesn’t happen during the flag. It happens right after—when price expands rapidly, confirming institutional momentum.
The real pros? They don’t just trade the flag. They anticipate the expansion phase and position themselves before the breakout.
Why Most Traders Miss It:
- They wait for confirmation that’s already priced in
- They misunderstand volume dynamics
- They forget the impact of macroeconomic catalysts
Let’s fix that.
The Expansion Phase: Your VIP Pass to Big Moves
The expansion phase is the part of the market cycle where momentum builds. Price, volume, and volatility all increase, driven by institutional players entering positions. If accumulation is the backstage warm-up, expansion is the stadium concert.
Here’s how to spot the early signs:
1. Volume Spikes After a Shallow Pullback
- A textbook bullish flag shows declining volume during consolidation. But once you see a sudden spike in volume, particularly on a bullish engulfing candle—institutions may be stepping in.
2. Hidden Divergence with Momentum Indicators
- Use RSI or MACD to catch hidden bullish divergence (where price makes a higher low, but the indicator makes a lower low). This is an advanced telltale sign of the expansion phase brewing.
3. Breakout Preceded by News or Economic Surprise
- Expansion phases often sync with catalysts: positive earnings, unexpected economic data, or central bank hints. According to Forex Factory, over 72% of high-impact news events precede breakout moves in trending pairs.
4. Price Tightens, Then Launches
- Price action contracts into a tight range (think: squeezing toothpaste). Then bam—volatility rips through resistance like it owes you money.
Pro Tip: Use ATR (Average True Range) to quantify expansion. If ATR increases by more than 1.5x its 14-day average after a bullish flag forms, you’re likely entering the expansion phase.
What Smart Money Looks For (That You Probably Don’t)
Institutions aren’t just tossing darts at a candlestick chart.
According to John Kicklighter, Chief Strategist at DailyFX:
“Institutions look for structural market inefficiencies and pair that with macro momentum. Most retail traders only see one side of the equation.”
Here’s what they pay attention to:
- Order Flow Data: Tools like Bookmap or Depth of Market to detect institutional absorption
- Intermarket Correlation: Watching commodity or bond market shifts to validate Forex pair trends
- Sentiment Flips: Using COT (Commitment of Traders) reports to see where big money is stacking
Case in Point: In Q4 2023, GBP/USD formed a textbook bullish flag while UK inflation surprised to the upside. Smart money bought the dip before the expansion, catching a 280-pip run. Retail? Most got in halfway through or chased the top.
The Myth of the Clean Breakout (And the Trap That Follows)
A clean breakout is the unicorn of trading—rare, beautiful, often photoshopped. Here’s why:
Expansion phases are messy.
- There will be false breaks
- Liquidity hunts
- Stop loss sweeps
That’s why blindly setting a buy-stop just above resistance is like trying to catch a frisbee during a hurricane—it’ll slap you.
Here’s a Better Entry Strategy:
1. Anticipation Entry (Aggressive)
- Enter near the bottom of the flag when momentum indicators flash divergence
- Use tight stop-losses and smaller position sizes
2. Retest Entry (Conservative)
- Wait for breakout > pullback > retest
- Confirm with rising volume and expanding ATR
3. Fade the Fade (Contrarian Ninja Style)
- When you spot a false breakout that reverses, fade the fakeout and ride the real expansion. But only if you’re fast, disciplined, and caffeinated.
How the Expansion Phase Plays Into Market Phases (Wyckoff Whisper Edition)
Richard Wyckoff fans, this one’s for you.
In Wyckoff terms, the expansion phase lives between accumulation and mark-up. The bullish flag often forms during re-accumulation—where price pulls back but big money continues to absorb liquidity.
Here’s the Cycle:
- Accumulation: Smart money quietly positions
- Re-accumulation / Flag: Shakeouts and sideways
- Expansion Phase: The big reveal—volume, volatility, price all explode
- Distribution: Smart money exits, often while retail is just entering
Knowing where you are in this cycle gives you an X-ray vision on the charts.
The Ninja Checklist for Bullish Flag Expansion
Here’s your step-by-step cheat code:
- Identify a Prior Uptrend
- Spot a Bullish Flag (Declining Volume + Tight Range)
- Watch for Hidden Divergence in Momentum
- Scan Economic Calendar for High-Impact Events
- Monitor ATR for Rising Volatility
- Look for Volume Surge Before Breakout
- Enter Aggressively (Anticipation) or Wait for Retest
- Use a Trading Journal to track your expansion-phase plays (Get One Free)
Little-Known Secret: Expansion Phase Loves Confluence
One thing I’ve learned (usually the hard way)? Expansion phases become laser-precise setups when they align with other tools:
- Fibonacci retracement levels
- VWAP deviations
- Psychological round numbers
For example, if your bullish flag breakout aligns with the 61.8% Fib level and sits on top of a round number like 1.3000? That’s not coincidence—it’s confluence.
Add in rising ATR and volume? Chef’s kiss.
Let’s Wrap This Up With Some Brutal Truth
Trading the expansion phase of a bullish flag isn’t just about clicking buttons. It’s about reading the undercurrents of momentum, timing, and smart money behavior.
While retail traders chase confirmation, you’ll already be in position—because you understand the power of expansion.
Quick Recap of Your Strategic Edge:
- Recognize early expansion signals like volume spikes and hidden divergence
- Use confluence tools like ATR, Fib, and economic events to confirm timing
- Avoid chasing breakouts—look for tight entries and aggressive exits
If you want the exact tools, updates, and playbooks pros use to nail these setups, don’t DIY your strategy:
—————–
Image Credits: Cover image at the top is AI-generated
PLEASE NOTE: This is not trading advice. It is educational content. Markets are influenced by numerous factors, and their reactions can vary each time.

Anne Durrell & Mo
About the Author
Anne Durrell (aka Anne Abouzeid), a former teacher, has a unique talent for transforming complex Forex concepts into something easy, accessible, and even fun. With a blend of humor and in-depth market insight, Anne makes learning about Forex both enlightening and entertaining. She began her trading journey alongside her husband, Mohamed Abouzeid, and they have now been trading full-time for over 12 years.
Anne loves writing and sharing her expertise. For those new to trading, she provides a variety of free forex courses on StarseedFX. If you enjoy the content and want to support her work, consider joining The StarseedFX Community, where you will get daily market insights and trading alerts.
Share This Articles
Recent Articles
The GBP/NZD Magic Trick: How Genetic Algorithms Can Transform Your Forex Strategy
The British Pound-New Zealand Dollar: Genetic Algorithms and the Hidden Forces Shaping Currency Pairs
Chande Momentum Oscillator Hack for AUD/JPY
The Forgotten Momentum Trick That’s Quietly Dominating AUD/JPY Why Most Traders Miss the Signal
Bearish Market Hack HFT Firms Hope You’ll Never Learn
The One Bearish Market Hack High Frequency Traders Don't Want You to Know The
