
The Hidden Combo: Bollinger Bands + Bullish Pennant = Forex Goldmine
Ever accidentally clicked ‘Buy’ instead of ‘Sell’ and watched your account drop faster than your phone on a tiled floor?
We’ve all been there. But what if I told you there’s a chart pattern and indicator combo that might actually save your dignity—and your balance?
Yes, I’m talking about the power duo: Bollinger Bands and the Bullish Pennant. On their own, they’re impressive. But when combined with a sprinkle of insider wisdom, they’re basically the Batman and Robin of breakout trading—minus the spandex.
Let’s dig into the underground tactics, little-known secrets, and advanced strategies that only the pros (and now you) are using.
“Pattern Recognition is an Art—But Profitable Pattern Recognition is a Science”
Before you start randomly drawing triangles on your chart like it’s kindergarten art time, let’s clarify what we’re working with here.
Bullish Pennant — AKA, The Calm Before the Bull
A bullish pennant is that tight, coiled spring of price action that forms after a strong uptrend. It looks like a mini symmetrical triangle or flag on a stick, and it signals one thing: the bulls are catching their breath before the next charge.
Pole = Impulse move (big green candles marching up like a caffeinated army)
Pennant = Consolidation (price contracting in a symmetrical triangle)
Breakout = ????
Now, where does Bollinger Bands come in?
Bollinger Bands: The Volatility Whisperer
Created by the brilliant John Bollinger (a man who probably dreams in standard deviations), Bollinger Bands are volatility-based envelopes placed above and below a simple moving average.
They tighten during low volatility and expand during high volatility. That’s important, because when those bands start squeezing—something’s about to pop. Kinda like when grandma’s pressure cooker hisses… either delicious stew or kitchen chaos is coming.
The Hidden Synergy: How the Bands Supercharge the Pennant
Most traders use Bollinger Bands to catch breakouts or spot mean reversion trades. But here’s what they’re sleeping on:
“When a Bullish Pennant forms within tightening Bollinger Bands, it’s a sniper setup—not a shotgun scatter.”
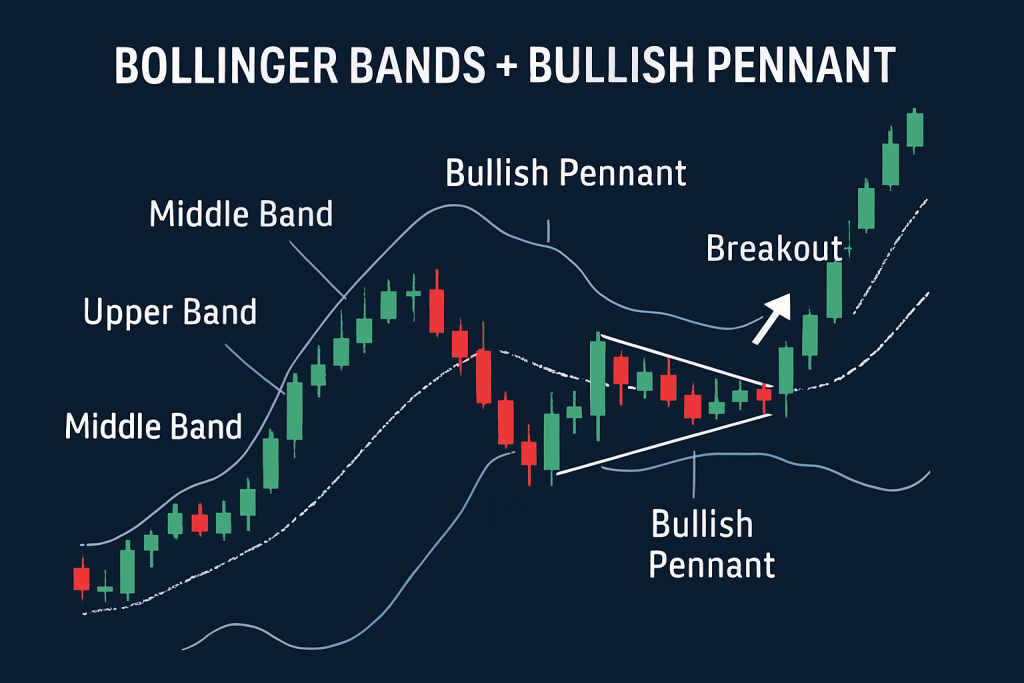
Here’s how the synergy works:
Price surges and forms the bullish pole
Consolidation forms the pennant while the bands squeeze
Volume dries up—market naps like a cat in a sunbeam
As the pennant nears the apex, price hugs the mid-band (SMA) tighter
BOOM—a breakout beyond the upper band with rising volume = high-probability long trade
Pro Tip: If price breaks above the upper Bollinger Band AND out of the pennant at the same time, that’s your cue to hit “buy” like you’re refreshing for concert tickets.
Why Most Traders Get It Wrong (And How You Can Avoid It)
Let’s address the elephant in the trading room: most retail traders misuse both tools.
They:
Jump in before the breakout
Chase price after it’s already pumped
Ignore volume like it’s the Terms & Conditions screen
Result? False breakouts. Slippage. FOMO-induced regret.
But here’s what next-level traders do instead:
Elite Entry Checklist:
✅ Wait for Bollinger Bands to narrow significantly (volatility squeeze)
✅ Confirm pennant structure: lower highs + higher lows
✅ Watch for breakout candle to close above upper band
✅ Confirm volume spike on breakout
✅ Set stop-loss just below pennant base
✅ Use measured move from pole to target breakout zone
Case Study: GBP/USD — The Sneaky Breakout You Missed
Let’s rewind to the 1H chart on GBP/USD (Jan 2025). Here’s what happened:
Price surged 160 pips after strong UK GDP data
Consolidated for 5 candles in a perfect pennant
Bollinger Bands narrowed from 85 pips to just 22
Breakout candle closed above the band + pennant apex
Volume tripled. Price rocketed another 130 pips
If you waited for confirmation and followed our strategy, that was a clean 1:3 risk/reward. If you blinked or hesitated, well… let’s just say hindsight isn’t a tradable signal.
The Forgotten Filter: Using the Middle Band as Support
Most traders obsess over the outer bands. But did you know the 20-SMA (middle band) is one of the most underrated support zones in this setup?
If the pennant forms and the price keeps bouncing off the middle band?
That’s like a trader’s version of “green flags” in dating.
You’re watching buyers defend the moving average, building pressure. That mid-band bounce is your early signal that bulls are not done playing.
Underground Tip: The Bollinger Band “Pre-Expansion” Secret
Here’s something that rarely makes the textbooks:
When the Bollinger Bands slightly tilt upwards before the breakout, it increases the probability of continuation.
This pre-expansion often happens one or two candles before the big move. It’s like the market whispering, “Hey… something’s cooking.”
So don’t just watch for a squeeze—watch for the band tilt. Combine that with a bullish pennant, and you’ve got a sniper-level setup.
Ninja Tactics: Combining Bollinger Bands with RSI for Maximum Impact
Want to crank the odds even higher?
Add a 14-period RSI
Look for the RSI to bounce from 50 during consolidation
If RSI crosses 60 at the same time price breaks the pennant and the upper Bollinger Band? That’s confirmation city.
RSI divergence can also act as a warning: if price breaks out but RSI is lagging or diverging… consider sitting it out or tightening stops.
Step-by-Step: How to Trade This Like a Pro
Here’s your bulletproof 6-step game plan:
Identify a strong upward impulse followed by sideways consolidation (bullish pennant).
Apply Bollinger Bands (20,2) and confirm a squeeze.
Wait for the breakout candle to close above both the pennant and the upper Bollinger Band.
Confirm a volume spike and check RSI > 60.
Set your stop-loss just below the pennant’s base or mid-band.
Use a measured move (length of the pole) to project your target.
Bonus Tip: Trail your stop along the upper band for max gains and graceful exits.
Expert Insights
John Bollinger, creator of Bollinger Bands, once said:
“Bollinger Bands provide a relative definition of high and low.”
Use that relativity with breakout patterns, and you’ll see setups others miss.
Kathy Lien, Managing Director of FX Strategy at BK Asset Management:
“Combining indicators is key—no tool should be used in isolation. Volume, price action, and volatility should all align.”
We couldn’t agree more, Kathy.
Exclusive Tools to Boost This Strategy
???? Want to put this to the test in real-time? We’ve got the tools and community to take you there:
???? Smart Trading Tool – Automate your lot size, orders, and trail stops like a pro.
???? Forex Education – Learn how to read market structure like Sherlock reads crime scenes.
???? Free Trading Journal – Track every breakout, every pennant, and your growth curve.
???? StarseedFX Community – Daily alerts, insider tips, and live trade breakdowns.
What You’ll Take Away (Elite Tactics Recap)
Combine Bollinger Band squeezes with Bullish Pennants for high-probability breakout setups
Use the middle band as a hidden support filter
Watch for pre-expansion tilt on the bands for early breakout signals
Confirm with volume and RSI for sniper entries
Use a measured move to set realistic profit targets
Join a trusted community and leverage smart tools to level up faster
Now You Know. So, What Will You Do Differently Today?
Will you keep drawing triangles and praying for breakouts? Or will you combine volatility metrics with price patterns and dominate the market like a quiet assassin?
Leave a comment. Share your experiences. Or better yet, join the StarseedFX community and get live alerts when setups like this hit the charts.
—————–
Image Credits: Cover image at the top is AI-generated
PLEASE NOTE: This is not trading advice. It is educational content. Markets are influenced by numerous factors, and their reactions can vary each time.

Anne Durrell & Mo
About the Author
Anne Durrell (aka Anne Abouzeid), a former teacher, has a unique talent for transforming complex Forex concepts into something easy, accessible, and even fun. With a blend of humor and in-depth market insight, Anne makes learning about Forex both enlightening and entertaining. She began her trading journey alongside her husband, Mohamed Abouzeid, and they have now been trading full-time for over 12 years.
Anne loves writing and sharing her expertise. For those new to trading, she provides a variety of free forex courses on StarseedFX. If you enjoy the content and want to support her work, consider joining The StarseedFX Community, where you will get daily market insights and trading alerts.
Share This Articles
Recent Articles
The GBP/NZD Magic Trick: How Genetic Algorithms Can Transform Your Forex Strategy
The British Pound-New Zealand Dollar: Genetic Algorithms and the Hidden Forces Shaping Currency Pairs
Chande Momentum Oscillator Hack for AUD/JPY
The Forgotten Momentum Trick That’s Quietly Dominating AUD/JPY Why Most Traders Miss the Signal
Bearish Market Hack HFT Firms Hope You’ll Never Learn
The One Bearish Market Hack High Frequency Traders Don't Want You to Know The
