
The Symmetrical Triangle Setup No One Talks About (Until Now): A Ninja Guide to Trading USD/CHF Like a Ghost in the Market
If you’ve ever stared at your USD/CHF chart, noticed a suspicious triangle forming, and wondered, “Is this the Forex market sending me an encrypted message… or just another technical mirage?” — congrats. You’ve just unlocked the doorway to one of the most overlooked yet powerful price formations in advanced technical analysis: the symmetrical triangle.
In this deep dive, we’re going full-on ninja mode. We’ll unpack the real meaning behind this geometrical enigma, explore how it behaves uniquely on the USD/CHF pair, and break down pro-level strategies that most retail traders will never use because they’re too busy arguing on Reddit.
Triangle or Trap? The Hidden Structure That Whispers Before It Moves
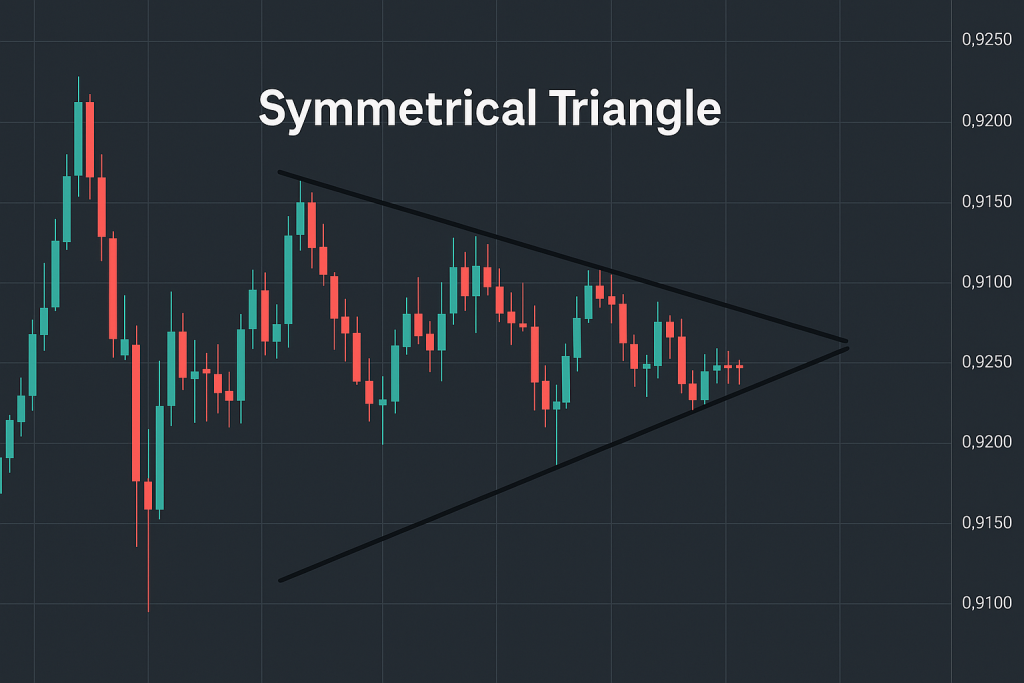
The symmetrical triangle is like that quiet genius in class—doesn’t talk much, but when it does, people listen. It’s formed when price consolidates between two converging trendlines, with higher lows and lower highs compressing volatility like a shaken soda bottle waiting to explode.
But here’s the kicker: not all symmetrical triangles are created equal. On most currency pairs, it’s a 50/50 bet on breakout direction. But with USD/CHF, the plot thickens. Why? Because this pair is the forex equivalent of a Swiss watch—precise, sometimes painfully slow, and highly reactive to interest rate differentials and risk sentiment.
“The key with USD/CHF is not predicting, but positioning,” says Kathy Lien, Managing Director at BK Asset Management. “It reacts not just to U.S. data, but global risk sentiment. When fear spikes, CHF strengthens. When yields rise, USD gains ground.”
So what does that mean for the symmetrical triangle?
Let’s break it down.
Inside the Triangle: Where the Smart Money Waits (While Retail Chases Candles)
Retail traders tend to treat symmetrical triangles like toasters—plug it in, wait for the breakout, and boom, profits. But the smart money? They treat them like high-stakes chess.
Here’s how the insiders actually use this pattern to stalk breakout setups on USD/CHF:
1. Wait for the Compression Squeeze on the 4H Chart
Look for at least 5 price touches (3 on one trendline, 2 on the other minimum).
Confirm the ATR (Average True Range) is declining—this shows volatility compression.
Add a volume oscillator (like the Chaikin Oscillator) to detect false breakouts—a surge in volume is often the telltale sign of the real move.
2. Front-Run Breakouts Using Options Flow (Yes, Really)
This is where it gets spicy. One lesser-known trick among prop firms is to monitor USD/CHF option strike activity around triangle apexes. According to CME data, a surge in short-dated options volume often precedes breakouts.
You can monitor options volume through the CME FX dashboard or use third-party tools like SaxoTrader or OANDA Order Book.
Look for concentrated strikes near triangle boundaries—these often signal institutional intent.
3. Fade the First Break, Trade the Retest
This one’s a gem: institutional traders often let price fake out of a triangle first. Why? To trigger stops and create liquidity.
Let the breakout happen.
Wait for a pullback to the broken trendline.
Confirm the retest with a momentum divergence (MACD or RSI divergence works well here).
Enter only after a second confirmation candle closes above/below the retest zone.
“Retail gets chopped, institutional players wait for the flush,” says John Kicklighter, Chief Strategist at DailyFX. “They treat triangles like traps, not triggers.”
USD/CHF’s Personality Problem (and How to Exploit It)
Let’s be honest—USD/CHF isn’t the life of the party. It’s more like the guy who shows up on time, brings a Swiss chocolate bar, and quietly monitors everyone else’s trades. But that’s its secret weapon.
Unlike the more emotionally volatile EUR/USD or GBP/JPY, USD/CHF is a macro-driven slow burner. That means when the breakout finally comes? It means something.
Here are a few USD/CHF-specific quirks to exploit:
The Risk Aversion Spike
When markets crash (like during the March 2023 banking panic), USD/CHF often drops as CHF is seen as a safe haven.
If a symmetrical triangle forms during a high-volatility news week (like FOMC or NFP), anticipate a potential downside breakout.
SNB Intervention Alert
Don’t sleep on the Swiss National Bank. They’re notorious for currency intervention.
If the triangle apex aligns with SNB or Fed announcements, be extra cautious of whipsaws.
News Catalyst Mapping
Use tools like the StarseedFX Economic Calendar to map triangle apex dates with red-flag news events.
Tip: Breakouts that occur just before a major event often reverse. Wait until after the event for confirmation.
The Advanced Trader’s Playbook: USD/CHF Symmetrical Triangle Setup
Here’s the full checklist elite traders use before committing capital:
Chart Timeframe: 4H or Daily.
Pattern Completion: Minimum of 5 touches.
ATR Compression: Confirm declining volatility.
Volume Confirmation: Spike in Chaikin or OBV near apex.
News Awareness: Apex proximity to FOMC, SNB, NFP, CPI.
Options Activity: Unusual short-dated volume near triangle tips.
Break & Retest: Enter only after retest confirmation.
What Most Traders Get Wrong (And How You Can Outwit Them)
???? Mistake #1: Trading the breakout too early
???? Ninja Move: Use alerts at trendlines, not instant orders.
???? Mistake #2: Ignoring macro context
???? Ninja Move: Overlay the DXY and VIX indices on your chart for intermarket confirmation.
???? Mistake #3: Using tight stops inside the triangle
???? Ninja Move: Place stops outside false breakout zones—or use ATR-based dynamic stops (we built this into the StarseedFX Smart Trading Tool).
Real-World Case Study: When the Triangle Paid Rent
In August 2023, a textbook symmetrical triangle formed on the USD/CHF 4H chart. Price was coiling for 6 days. Right as the Fed’s Jackson Hole Symposium began, the pair faked north, only to reverse sharply and drop 130 pips.
Traders who waited for the retest entry netted clean RR setups of 3:1 or better—without chasing price or losing sleep.
And yes, I took that trade. And yes, I treated myself to Swiss chocolate afterward (the good kind—the 85% cocoa “I know I’m an adult now” kind).
The Underground Edge: Tools, Tactics, and Secrets You Won’t Find on YouTube
???? Want the triangle to tell you when it’s ready to move? Use this hidden combo:
TrendSpider: Automate symmetrical triangle detection.
Volume Oscillator: Validate breakout conviction.
StarseedFX Smart Tool: Instantly calculate position sizing based on triangle width and ATR.
FX Options Watcher: Monitor pre-breakout institutional interest (like a spy with a Bloomberg Terminal).
Quick Recap: Elite Tactics You Just Unlocked
✅ Use options activity to pre-empt institutional breakouts.
✅ Confirm with ATR compression and volume spikes.
✅ Never trade the first break—trade the retest.
✅ Know the USD/CHF quirks (SNB, fear flows, DXY signals).
✅ Combine pattern recognition with macro overlays for next-level precision.
Want More Ninja-Level Insights Like These?
You’re just scratching the surface. At StarseedFX, we serve rare Forex strategies like this every day:
???? Forex News & Economic Shifts – Break down market chaos into tradable gems.
???? Free Forex Courses – Dive deep into triangle pattern mastery and beyond.
???? Join Our Elite Trading Community – Get daily alerts, trade setups, and live market breakdowns.
???? Smart Trading Tool – Automate triangle stop loss & position sizing.
???? Free Trading Plan & Journal – Build a battle plan, track wins, and tweak for growth.
Final Thought: Not All Triangles Are Pyramids, But This One Can Build Wealth
If you’re just chasing triangle breakouts blindly, you’re doing what 90% of retail traders do—and getting 90% of their results.
But now you know the real game behind symmetrical triangles on USD/CHF.
Trade like a sniper, not a spray-and-pray warrior. And maybe—just maybe—you’ll find yourself on the right side of the triangle.
—————–
Image Credits: Cover image at the top is AI-generated
PLEASE NOTE: This is not trading advice. It is educational content. Markets are influenced by numerous factors, and their reactions can vary each time.

Anne Durrell & Mo
About the Author
Anne Durrell (aka Anne Abouzeid), a former teacher, has a unique talent for transforming complex Forex concepts into something easy, accessible, and even fun. With a blend of humor and in-depth market insight, Anne makes learning about Forex both enlightening and entertaining. She began her trading journey alongside her husband, Mohamed Abouzeid, and they have now been trading full-time for over 12 years.
Anne loves writing and sharing her expertise. For those new to trading, she provides a variety of free forex courses on StarseedFX. If you enjoy the content and want to support her work, consider joining The StarseedFX Community, where you will get daily market insights and trading alerts.
Share This Articles
Recent Articles
The GBP/NZD Magic Trick: How Genetic Algorithms Can Transform Your Forex Strategy
The British Pound-New Zealand Dollar: Genetic Algorithms and the Hidden Forces Shaping Currency Pairs
Chande Momentum Oscillator Hack for AUD/JPY
The Forgotten Momentum Trick That’s Quietly Dominating AUD/JPY Why Most Traders Miss the Signal
Bearish Market Hack HFT Firms Hope You’ll Never Learn
The One Bearish Market Hack High Frequency Traders Don't Want You to Know The
