
The AUD/USD Ascending Triangle Playbook Wall Street Doesn’t Want You to Master
If you’ve ever stared at a chart, spotted an ascending triangle on AUD/USD, and whispered “Is this… finally the breakout?”—this guide is for you.
We’re peeling back the curtain on one of the most misunderstood (and misused) patterns in Forex, breaking it down with precision, wit, and war-tested ninja tactics.
But First, the Elephant in the Trading Room…
Why do so many traders butcher the ascending triangle on AUD/USD like it’s a piñata filled with pip-sized disappointments?
Here’s the deal: most guides teach you the basic shape. They don’t tell you how institutions exploit this formation, how to anticipate fakeouts, or how to load up like a sniper (not a shotgun trader spraying orders everywhere).
Let’s fix that.
The Hidden Geometry of Market Confidence: Why This Pattern Matters
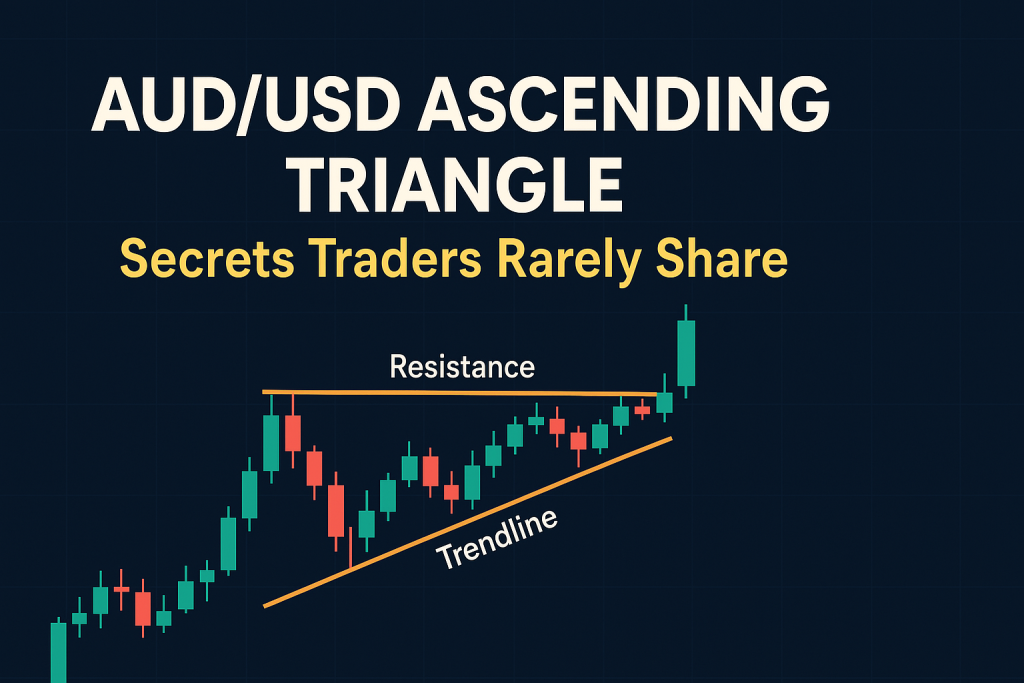
An ascending triangle on the AUD/USD chart isn’t just a bullish signal—it’s a psychological battlefield.
???? Buyers push higher lows. Sellers cling to a fixed resistance.
Translation? Confidence is building beneath the surface, like a kettle ready to whistle… or explode.
But not all triangles are created equal. A clean ascending triangle on AUD/USD during the Asian-to-London overlap? That’s gold. A sloppy one in post-NFP chaos? That’s a Picasso drawn by your cat.
Why Most Traders Misread This Setup (And How to Outsmart Them)
Here’s the funny thing: 80% of ascending triangle breakouts fail because people forget to zoom out.
Yep—people trade the triangle on the 5-minute chart with the urgency of ordering takeout, not realizing that price is actually trapped in a higher timeframe supply zone.
???? Insider Tactic: Before entering any ascending triangle breakout on AUD/USD, cross-check with the 4H or Daily timeframes for confluence. If the triangle sits directly under a major resistance cluster or Fibonacci level—brace for a fakeout.
“Markets are fractal in nature. Without top-down confluence, your lower timeframe breakout is just noise.”
— Linda Raschke, legendary trader and market technician
The Three-Point Triangle Trap: A Ninja Test Most Ignore
Here’s a fun one: try this before trading any AUD/USD ascending triangle.
The 3-Point Confirmation Rule:
At least 3 clean higher lows
Flat resistance line with wicks, not closes
Breakout volume spike must exceed previous 5 bars combined
???? If any of these are missing? Walk away. You’re not looking at a breakout. You’re staring at a market trap wrapped in wishful thinking.
Think of it like dating: if they’re only texting at midnight and never introduce you to their friends—it’s not a triangle, it’s a trap.
What Institutions Do Differently: The Breakout + Retest Scam
Retail traders love breakout entries. Big players? They love fake breakouts.
Here’s how they flip the script:
They engineer a false breakout during low liquidity (think 1 AM NY time).
Retail jumps in.
They reverse the price.
Retail panic-sells.
Institutions reload at a discount—then push the real breakout.
???? Elite Tactic: Trade the retest, not the first break. The second touch of resistance-turned-support with tightening spreads and bullish candle closes? That’s your moment.
The Timeframe Mismatch that Kills Profits
If you’re analyzing an ascending triangle on the 1-hour AUD/USD chart but entering on the 15-minute… congratulations, you’ve just mismatched your entire setup.
This is like preparing to run a marathon and showing up in flip-flops.
???? Advanced Strategy: The Tri-Frame Entry Approach
Identify the ascending triangle on the 1H chart.
Confirm confluence with 4H trend direction and economic context (is the RBA dovish while Fed leans hawkish?).
Enter on 15M pullback using a bullish engulfing candle, tight stop, and Smart Lot Size Tool for proper sizing (link).
AUD/USD and Economic Catalysts: The News Combo That Supercharges Triangles
AUD/USD doesn’t break out in a vacuum. Watch these triggers:
???? RBA Rate Statement
????️ China PMI Data (Australia’s largest trade partner)
???? US Core PCE or CPI
“AUD/USD behaves like a commodity proxy. Understanding China’s economy is key to anticipating volatility.”
— John Kicklighter, Chief Strategist at DailyFX
⚠️ Don’t place breakout trades within 2 hours of these events. The triangle might be real, but the catalyst hasn’t hit yet.
The Forgotten Strategy: Volume Profile Meets Ascending Triangle
Most traders look at candlesticks. Elite traders look at volume clusters.
???? Use volume profile tools to check where the most recent high-volume nodes cluster. If the ascending triangle is forming just below a heavy volume shelf? That breakout could punch through like Bruce Lee in a paper dojo.
Bonus: Hidden divergence on RSI + ascending triangle + volume shelf breakout = 3-star setup.
The Step-by-Step Triangle Execution Plan (for Sniper Entries)
Let’s break it down like a mission briefing:
Identify a clean ascending triangle on the 1H or 4H AUD/USD chart.
Confirm confluence with fundamentals (China data, RBA/Fed narrative).
Mark key levels using wicks, not closes.
Use volume profile to check for hidden resistance clusters.
Wait for breakout volume spike.
Enter on retest, ideally with bullish engulfing confirmation.
Use the StarseedFX Smart Tool to size your trade with precision.
Log the trade in your Free Trading Journal to review later.
???? Pro tip: If the triangle fails, don’t chase—wait for price to reclaim structure. That’s your second chance, not a reason to revenge trade.
Hidden Patterns and Game-Changers Most Ignore
✔️ Liquidity Pools Above the Triangle: Use order flow tools to spot clustered liquidity—breakouts often target those levels.
✔️ Session Overlap Strength: Breakouts that occur during the London/NY overlap have higher follow-through.
✔️ Fractal Triangle Clusters: Sometimes, mini triangles form inside larger ones—this signals accumulation and often precedes explosive moves.
Don’t Just Trade It. Master It.
Trading AUD/USD with ascending triangles isn’t about copying textbook setups. It’s about knowing what others don’t—the deeper patterns, institutional behavior, and the timing game.
But here’s where the real magic happens…
???? Get Elite-Ready with These Free Resources:
Because the truth is: one triangle breakout won’t change your life. But mastering setups, entries, and mindset absolutely will.
Now go trade like a ninja, not a noob.
???? What You Just Unlocked:
???? The real psychology behind AUD/USD ascending triangle patterns
???? Advanced entry tactics used by institutional traders
???? Volume profile and time-based confluence methods
???? Step-by-step breakout trade execution checklist
???? Real-world economic triggers and expert-backed strategies
—————–
Image Credits: Cover image at the top is AI-generated
PLEASE NOTE: This is not trading advice. It is educational content. Markets are influenced by numerous factors, and their reactions can vary each time.

Anne Durrell & Mo
About the Author
Anne Durrell (aka Anne Abouzeid), a former teacher, has a unique talent for transforming complex Forex concepts into something easy, accessible, and even fun. With a blend of humor and in-depth market insight, Anne makes learning about Forex both enlightening and entertaining. She began her trading journey alongside her husband, Mohamed Abouzeid, and they have now been trading full-time for over 12 years.
Anne loves writing and sharing her expertise. For those new to trading, she provides a variety of free forex courses on StarseedFX. If you enjoy the content and want to support her work, consider joining The StarseedFX Community, where you will get daily market insights and trading alerts.
Share This Articles
Recent Articles
The GBP/NZD Magic Trick: How Genetic Algorithms Can Transform Your Forex Strategy
The British Pound-New Zealand Dollar: Genetic Algorithms and the Hidden Forces Shaping Currency Pairs
Chande Momentum Oscillator Hack for AUD/JPY
The Forgotten Momentum Trick That’s Quietly Dominating AUD/JPY Why Most Traders Miss the Signal
Bearish Market Hack HFT Firms Hope You’ll Never Learn
The One Bearish Market Hack High Frequency Traders Don't Want You to Know The
