
The DMI Decoder: How Pros Read USD/CAD Like a Spy Script
Ever looked at the USD/CAD chart and thought, “I swear this pair is gaslighting me”? You’re not alone.
The Directional Movement Index (DMI) is that one indicator that quietly sits in the corner of the party, sipping its espresso, judging the chaos—and yet, it knows everything. Especially when it comes to the US Dollar Canadian Dollar pair, a duo with more drama than a reality TV couple on a fishing trip in Alberta.
But here’s the twist: most traders use the DMI like a tourist reading a subway map upside down. We’re here to change that.
Let’s crack the code with proven strategies, hidden gems, and real-world examples so sharp they could slice through central bank jargon.
Why Most Traders Misread DMI (And Get Burned by the Loonie)
You’ve probably heard this: “When +DI crosses above -DI, go long!”
That’s like saying, “If it rains, wear a jacket.” It’s true—but do you wear a snow parka in a drizzle?
DMI on USD/CAD needs nuance, not knee-jerk trades. This pair’s choppy behavior, often tied to oil prices and macro data from both the U.S. and Canada, means DMI must be calibrated—not followed blindly.
???? Underground Insight:
“On choppy pairs like USD/CAD, DMI crossovers without confirming ADX strength are like cooking pasta without boiling water.”
– Naomi Stephens, Senior Analyst at FXEdge Analytics
Here’s how to tell when USD/CAD is actually directional and not just dancing side to side like it forgot the beat.
The Forgotten Filter That Unlocks DMI’s Full Power
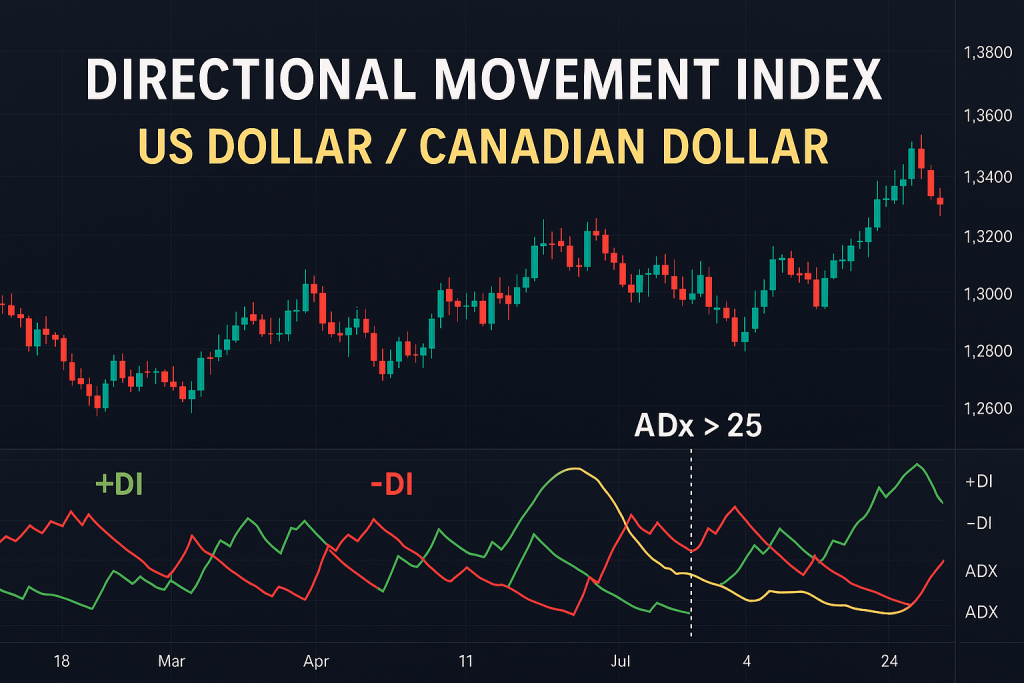
Meet ADX—the third wheel in the DMI love triangle. Traders often ignore it, but ADX is the secret sauce that tells you whether the trend is worth chasing or if it’s all smoke and no fire.
⚡ Ninja Technique:
ADX > 25 + Rising?
Now you’re cooking with gas. A rising ADX with a clean +DI/-DI separation on USD/CAD suggests real trend momentum.
ADX < 20 + Flat?
That’s chop. Walk away. Go outside. Hug your cat.
How Oil Prices Secretly Distort Your DMI Signals on USD/CAD
Let’s get spicy. Canada’s economy is oil-heavy. So when oil prices fluctuate, they whiplash the CAD—and by extension, the USD/CAD pair.
“Oil volatility adds noise to DMI signals on USD/CAD. Filter trades with a crude correlation overlay.”
– Julien Delacroix, Macro Strategist, CrudeMatrix Capital
???? Game-Changing Idea:
Use the DMI only when WTI crude oil is stable or trending in alignment with USD/CAD. If oil is spiking while USD/CAD trends opposite, abort mission. You’re in a data blender.
DMI Divergence: The Hidden Gem Nobody Talks About
Think RSI divergence is cool? Wait until you see DMI divergence.
???? How It Works:
USD/CAD makes a new high.
+DI makes a lower high.
ADX starts fading.
This means momentum is bailing out of the party before the guests even notice. Time to prep for reversal trades—before the crowd catches on.
???? Real Example (2024, March 12):
USD/CAD pushed to 1.3780, but +DI dipped below its previous peak while ADX fell. Within 48 hours, the pair dropped over 90 pips. Traders who spotted this DMI divergence were sipping profits like fine maple syrup.
Why DMI Works Best on the 4H Timeframe for USD/CAD
Here’s where most retail traders mess up—they use DMI on the daily or worse, the 15-minute chart. That’s like using a microscope to navigate rush hour traffic.
???? Best Practice Setup:
4H Timeframe
DMI with ADX smoothed over 14 periods
Confirm signals with:
MACD histogram
Crude Oil trend (30M overlay)
“The 4H gives you the goldilocks zone—not too reactive, not too slow. Perfect for swing entries on USD/CAD.”
– Kirk Larsen, Prop Trader & Technical Analyst at StarseedFX
Real Trader Use-Case: The Swing Trade That Made the Week
???? Date: Feb 28, 2025
???? Pair: USD/CAD
???? Setup:
+DI crossed above -DI
ADX was rising from 18 to 27
Crude oil stabilized
4H candle broke resistance
???? Result:
Entered long at 1.3580 → Exited at 1.3695.
+115 pips, zero drama.
???? Used StarseedFX’s Smart Trading Tool to auto-calculate lot size and place a trailing stop, locking in 85% of the move.
The Rule of Three: The Best Way to Trade DMI on USD/CAD
To simplify DMI into a rule-based framework, use this:
✅ DMI Triple Confirmation Checklist:
+DI/-DI crossover aligns with market direction.
ADX is above 25 and rising.
Crude oil isn’t contradicting the signal.
If all three align? Fire the trade. If only two? Reduce risk. If only one? Keep your powder dry.
3 Hidden Traps When Using DMI on USD/CAD
Oil Shock Ignorance: Always check oil futures before trading DMI on this pair.
ADX Flatlining? Means no trend. Don’t try to force a pattern like your cousin forcing NFTs at family dinners.
Micro Timeframes: Avoid anything below 1H unless you enjoy fakeouts and emotional damage.
Step-by-Step Guide: DMI-Based USD/CAD Swing Trade
Open USD/CAD on the 4H chart.
Add DMI (14) with ADX visible.
Check for clear +DI/-DI crossover.
Confirm ADX is >25 and rising.
Review WTI Crude chart—ensure no oil shocks.
Confirm breakout/breakdown levels with price action.
Set stop-loss just outside the consolidation zone.
Use a trailing stop with the StarseedFX Smart Trading Tool.
The One Trick That Separates DMI Pros from Rookies
Rookies chase crossovers. Pros chase convergence.
A seasoned trader looks for DMI to align with other indicators like MACD, volume spikes, and macro catalysts.
That’s the real edge—using DMI as a confirmation tool, not a greenlight machine.
Your Strategic Edge with StarseedFX
Want to automate, simplify, and amplify your DMI setups on USD/CAD?
Here’s how StarseedFX can upgrade your strategy:
???? Latest Market News: Stay ahead of DMI shifts driven by news → Forex News Today
???? Forex Education: Learn advanced setups with our in-depth training → Free Forex Courses
???? Join the Community: Get daily alerts, live trading, and DMI setups → Join Now
???? Free Trading Journal: Track your DMI trades, spot patterns → Download Journal
???? Smart Tool: Auto-calculate lot sizes & set precision stops → Get the Tool
???? What You’ve Learned: Elite Takeaways
✅ DMI crossovers alone are misleading—combine with ADX & macro filters.
✅ 4H timeframe is the sweet spot for swing entries.
✅ Oil correlation must always be considered with USD/CAD.
✅ DMI divergence = early reversal signal.
✅ Use StarseedFX tools to gain an unfair advantage (but legally).
—————–
Image Credits: Cover image at the top is AI-generated
PLEASE NOTE: This is not trading advice. It is educational content. Markets are influenced by numerous factors, and their reactions can vary each time.

Anne Durrell & Mo
About the Author
Anne Durrell (aka Anne Abouzeid), a former teacher, has a unique talent for transforming complex Forex concepts into something easy, accessible, and even fun. With a blend of humor and in-depth market insight, Anne makes learning about Forex both enlightening and entertaining. She began her trading journey alongside her husband, Mohamed Abouzeid, and they have now been trading full-time for over 12 years.
Anne loves writing and sharing her expertise. For those new to trading, she provides a variety of free forex courses on StarseedFX. If you enjoy the content and want to support her work, consider joining The StarseedFX Community, where you will get daily market insights and trading alerts.
Share This Articles
Recent Articles
The GBP/NZD Magic Trick: How Genetic Algorithms Can Transform Your Forex Strategy
The British Pound-New Zealand Dollar: Genetic Algorithms and the Hidden Forces Shaping Currency Pairs
Chande Momentum Oscillator Hack for AUD/JPY
The Forgotten Momentum Trick That’s Quietly Dominating AUD/JPY Why Most Traders Miss the Signal
Bearish Market Hack HFT Firms Hope You’ll Never Learn
The One Bearish Market Hack High Frequency Traders Don't Want You to Know The
