
“Symmetrical Triangle + Maximum Drawdown = The Ultimate Risk Trapdoor (Or Profit Slingshot)”
Spoiler: It’s both, depending on whether you’re a ninja… or a Netflix-binger.
The Sneaky Shape That Whispers Profits (But Screams Risk if Ignored)
There’s a reason symmetrical triangles get both love and side-eye from seasoned traders. To the untrained eye, they look like a geometry project on a caffeine high. But to those who know? They’re coiled springs of volatility and breakout potential.
More importantly — they have a shady relationship with maximum drawdown that’s rarely talked about. And like any good soap opera couple, they’re either your dream team or your downfall.
So grab a seat, because this isn’t your average “triangle pattern” article. We’re decoding the hidden mechanics, the drawdown landmines, and the elite-level setups that pro traders use to slice losses and boost asymmetric returns.
???? “Wait, What’s a Symmetrical Triangle Again?” (But Make It Ninja)
Let’s clarify, just so we’re slicing apples with samurai precision:
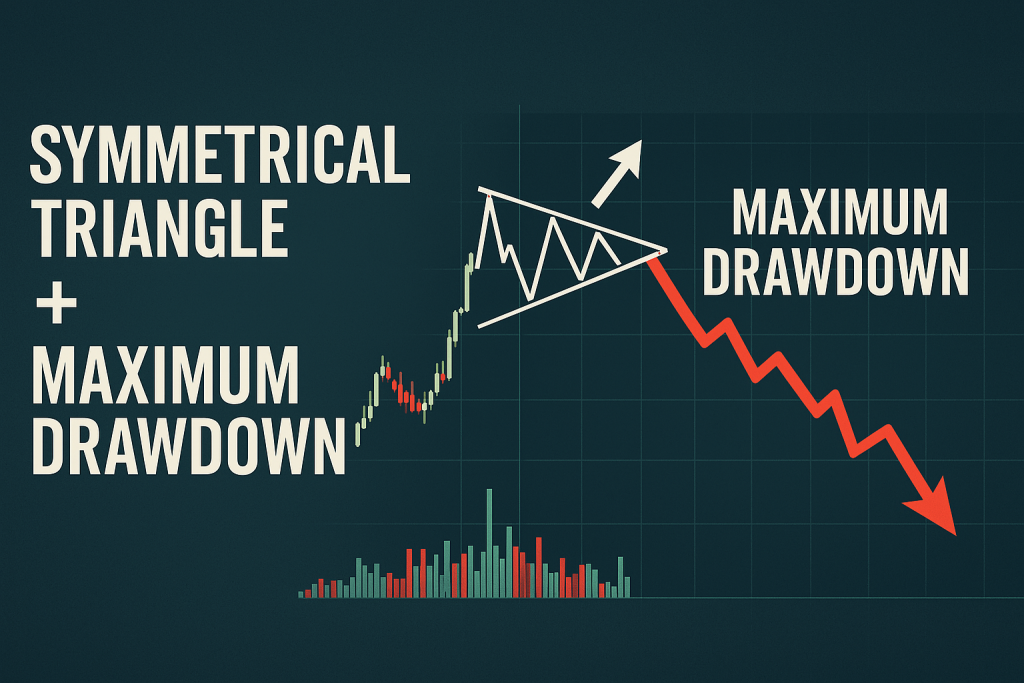
Symmetrical Triangle: A chart pattern formed when price consolidates with lower highs and higher lows, creating a triangle that leans on… well, symmetry.
It reflects a tug-of-war between bulls and bears, and the breakout — either up or down — can be explosive.
???? It’s like a rubber band being pulled tighter and tighter. Eventually, something’s gotta give.
But here’s the kicker: if you mismanage your trade size or don’t define your risk window, the ensuing breakout could yeet your account into drawdown hell before you even say “stop loss.”
???? The Hidden Risk: Symmetrical Triangles and Maximum Drawdown
Here’s where it gets juicy.
The biggest mistake traders make with symmetrical triangles is overleveraging before the breakout confirms. The pattern looks tight, safe, and predictable. But the reality?
Fakeouts + Overconfidence = Max Drawdown Nightmare.
Let’s break it down:
Common Drawdown Scenarios:
Pre-Breakout Positioning – You jump in early, trying to “predict” direction.
Leverage Without Confirmation – Because the range is tight, you stack leverage thinking the move is “small.” Plot twist: it’s a trap.
Breakout → Reversal – Price breaks out, triggers your trade, then reverses into a fakeout. Congrats, you’re in the red.
Overextended SLs – You widen your stop to “give it room,” and then the breakout happens — in the opposite direction.
???? Think of it like buying running shoes for a sprint, only to realize you signed up for a marathon through a swamp.
???? Case Study: How NOT to Trade Symmetrical Triangles
In early 2024, the GBP/JPY pair formed a textbook symmetrical triangle on the 4H chart. Traders flooded in, forecasting a bullish breakout. One Reddit user posted, “I just went 25x long — triangle breakout, here we go!”
Fast forward 8 hours: fakeout down, whiplash reversal, SL swept. Max drawdown: -32.8%.
Lesson? The triangle wasn’t the problem. Position sizing and entry strategy were.
???? The Hidden Formula Only Experts Use
Here’s the little-known framework pros apply when trading symmetrical triangles — a.k.a. how to minimize drawdown and maximize breakout success.
The “B-TRI” Formula:
Breakout Confirmation First
Wait for a close outside the triangle on higher timeframe (H1 or above).
Timeframe Sync
Confirm momentum using a higher TF like 4H or Daily — don’t rely on noisy M5 charts.
Risk Compression
Reduce position size by 30% pre-breakout, then scale-in once momentum confirms.
Insider Volume Check
Use OBV or Chaikin Oscillator to validate real volume pressure.
Institutional Magnet Zones
Identify supply/demand zones beyond triangle tips. Breakouts often seek liquidity clusters, not just “pattern symmetry.”
“Most symmetrical triangles are just volatility compression dressed in geometry. But when volume aligns with institutional intent — that’s your golden breakout.”
— Linda Raschke, Professional Trader & Author
???? Underground Stat: The Triangle-Drawdown Ratio
According to a recent study by the CME Group, symmetrical triangle breakouts succeed 61% of the time, but traders who enter pre-breakout face an average drawdown of 9.4% before the move completes.
That’s not just a number — that’s your rent money doing the limbo.
???? How to Use Symmetrical Triangles Without Burning Your Account
Let’s get tactical. Here’s a battle-tested framework to trade these patterns like a pro.
Step-by-Step Setup:
Identify Triangle on H1 or H4
Mark Breakout Zones + Fakeout Traps
Set Alert, Not Entry
Wait for Candle Close Beyond Triangle
Check Volume Spike (e.g. OBV or Volume Oscillator)
Enter With 50% Position Size First
Add Remaining 50% After Retest
Set SL Outside Triangle Opposite End
Target 2:1 or Trail with ATR x 2.5
???? Bonus Tip: Use the Smart Trading Tool from StarseedFX to auto-calculate optimal lot size and SL based on ATR. Ninja-level precision in seconds.
???? What Max Drawdown REALLY Reveals About Your Trading (And How to Fix It)
Max drawdown isn’t just about how much you lost — it’s about how you lose. Are your losses:
Coming from overconfidence in tight patterns?
The result of “hopium” instead of confirmation?
A sign of underutilized tools like trading journals or risk tracking?
If so, flip the script:
???? Track. Tweak. Triumph.
Use the Free Trading Journal to catch recurring mistakes.
Grab the Free Trading Plan to predefine drawdown limits before entering ANY pattern.
Join our Community for real-time alerts and expert setups that go far beyond chart patterns.
???? The One Simple Trick That Reduces Drawdown with Triangle Trades
Here’s something 90% of traders overlook:
“Drawdown is an output metric. Focus on improving input variables — like trade timing, lot size, and exit logic — and your drawdown shrinks without even trying.”
— Al Brooks, Price Action Expert
???? Translation? Stop obsessing over how much you lost — and start mastering when, why, and how you entered the trade in the first place.
???? The Final Takeaway (Or: What Would a Ninja Do?)
Next-Level Insights:
Symmetrical triangles are not breakout guarantees. They’re risk bottlenecks.
Maximum drawdown reveals discipline gaps, not just market randomness.
Wait, watch, and scale — the “WWaS” approach — protects your account like kevlar.
???? Here’s What You’ll Walk Away With:
???? How to trade symmetrical triangles without triggering your inner gambler
???? Secret tactics to reduce drawdown risk by 50%
???? The B-TRI framework for confirmation-based entry
???? Advanced triangle tactics no one talks about (volume sync + liquidity zones)
???? Tools to make it all easier, faster, smarter (via StarseedFX)
Want to cut the learning curve and plug into pro setups and real-time analysis?
???? Join our StarseedFX Community for daily alerts, setups, and live insights that actually work. Or grab our Smart Trading Tool to start thinking like a hedge fund, not a hobbyist.
???? Summary of Game-Changing Ideas:
Symmetrical triangles hide breakout power and drawdown traps.
Pre-breakout entries = major cause of max drawdown.
Use the “B-TRI” method for strategic triangle trading.
Drawdown isn’t the villain — poor prep is.
Combine smart tools + clear process = pro-level edge.
—————–
Image Credits: Cover image at the top is AI-generated
PLEASE NOTE: This is not trading advice. It is educational content. Markets are influenced by numerous factors, and their reactions can vary each time.

Anne Durrell & Mo
About the Author
Anne Durrell (aka Anne Abouzeid), a former teacher, has a unique talent for transforming complex Forex concepts into something easy, accessible, and even fun. With a blend of humor and in-depth market insight, Anne makes learning about Forex both enlightening and entertaining. She began her trading journey alongside her husband, Mohamed Abouzeid, and they have now been trading full-time for over 12 years.
Anne loves writing and sharing her expertise. For those new to trading, she provides a variety of free forex courses on StarseedFX. If you enjoy the content and want to support her work, consider joining The StarseedFX Community, where you will get daily market insights and trading alerts.
Share This Articles
Recent Articles
The GBP/NZD Magic Trick: How Genetic Algorithms Can Transform Your Forex Strategy
The British Pound-New Zealand Dollar: Genetic Algorithms and the Hidden Forces Shaping Currency Pairs
Chande Momentum Oscillator Hack for AUD/JPY
The Forgotten Momentum Trick That’s Quietly Dominating AUD/JPY Why Most Traders Miss the Signal
Bearish Market Hack HFT Firms Hope You’ll Never Learn
The One Bearish Market Hack High Frequency Traders Don't Want You to Know The
