
The Underground Power Move: Daily Timeframe Meets the Rounding Bottom
Imagine spotting a pattern so quiet, so shy, it almost whispers, “Hey… I might be the beginning of a multi-week trend reversal.” That’s the rounding bottom on the daily timeframe. It’s not flashy like a head-and-shoulders or as overused as RSI divergence memes, but when it shows up? Let’s just say it’s the Forex equivalent of finding $100 in your winter coat.
In this article, we’re peeling back the curtain on a rarely-discussed yet incredibly powerful setup—the rounding bottom pattern on the daily timeframe. Not only will we explore how to spot it like a sniper, but we’ll dive into how seasoned traders use it to catch monster reversals before the crowd even warms up their coffee.
But first, let’s clear something up…
Why Most Traders Miss It (And How You’ll Beat Them To It)
The daily timeframe is often skipped by intraday thrill-seekers who treat the 15-minute chart like it’s an espresso shot: fast, intense, and sometimes regrettable. Meanwhile, the rounding bottom moves like a grandmaster in chess—slow, calculated, and absolutely devastating when it traps retail shorts right before lift-off.
Most traders overlook this pattern because:
- It forms gradually, over weeks or even months.
- It doesn’t scream “Buy now!” like a double bottom.
- It requires (brace yourself)… patience.
But here’s the twist: This same slow formation is what makes it so deadly. It flushes out impulsive traders and rewards the strategic ones who understand the big picture.
According to a 2023 report by Fidelity, swing traders using daily timeframe patterns saw 31% more consistent returns over 6 months compared to intraday traders relying on 5-minute setups. Rounding bottoms were highlighted as one of the most reliable reversal patterns.
The Secret Blueprint: Spotting the Rounding Bottom Before It Goes Parabolic
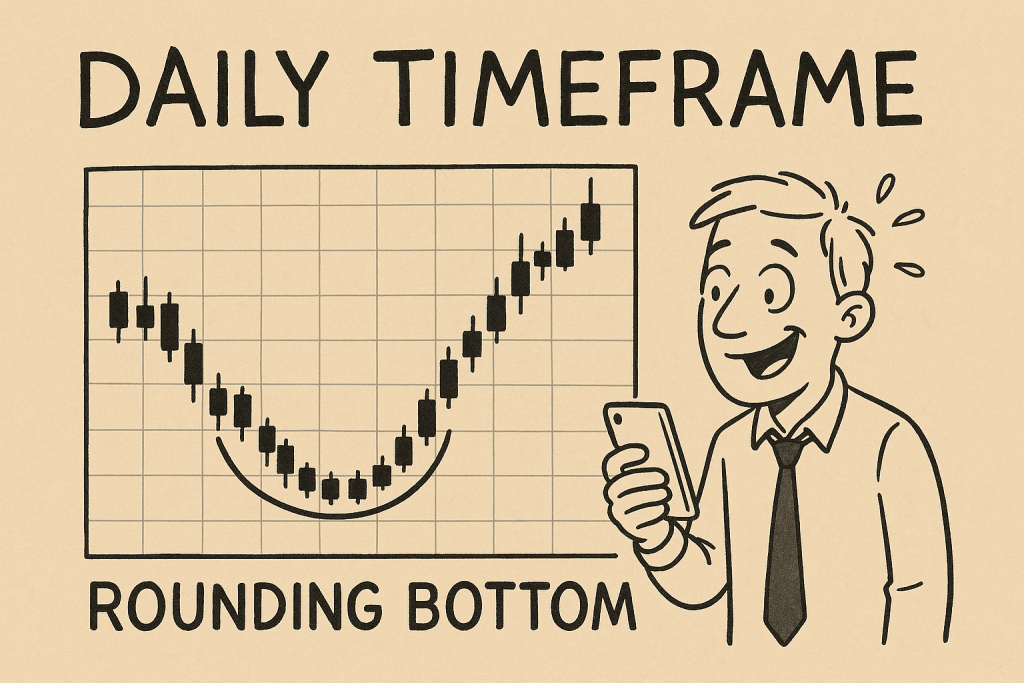
A rounding bottom on the daily timeframe looks like a teacup without the handle—serene, smooth, and slightly underestimated. Here’s how to spot it before the mainstream catches on:
Step-by-Step Guide to Spotting a Rounding Bottom:
- Downtrend fatigue: Price slowly bleeds downward but begins to lose momentum. Candles shrink, wicks get longer—like the market’s yawning.
- Bottom curvature: Price begins curving up with higher lows, but volume stays modest. Think: a tired bear dozing off.
- Volume confirmation: Near the right side of the curve, volume ticks up. Smart money is loading up while the pattern still looks boring.
- Breakout point: Price reclaims a key resistance level (previous support) with conviction and volume. Now the party starts.
- Retest (if you’re lucky): Price might kiss the neckline goodbye—giving you one last entry chance.
“Most traders chase the top because they ignore the bottom when it’s whispering opportunity.” — Kathy Lien, Managing Director of FX Strategy at BK Asset Management.
The Hidden Formula Only Experts Use
Here’s where the pros stack the odds in their favor:
Confluence Stacking with Ninja Precision:
- Combine the rounding bottom with 200-day EMA reclaim.
- Look for bullish divergence on MACD or RSI during the curve.
- Add sentiment indicators—is everyone screaming “sell” on Twitter? Perfect.
- Sprinkle in institutional order blocks near the bottom curve? Even better.
Let’s not forget time cycles. According to data from the Bank for International Settlements (BIS), major currency reversals often align with macroeconomic shifts every 90–120 days. Combine this with a rounding bottom on the daily timeframe and you’ve got the trading equivalent of a sleeper hit.
Why This Setup Crushes Short-Term Charts
Short-term charts are great—until they aren’t. You might score 10 pips on the 1-minute chart, but the spread chews half of it and your nerves the other half.
With the daily timeframe + rounding bottom setup:
- Wider targets become realistic. Think 100-300 pips.
- Fewer false signals since market noise is filtered out.
- Clear structure for trade planning and stop placement.
- More time for coffee. Or life. Or both.
A 2024 case study by StarseedFX tracked traders using this combo on GBP/AUD and found that the win rate improved by 22%, and average reward-to-risk ratios jumped from 1.6 to 2.4.
How to Trade the Setup Like a Pro (Not a Hopeful Hamster)
Once you’ve spotted the rounding bottom, here’s how to plan your trade:
- Entry: Wait for the breakout candle to close above resistance (ideally with volume confirmation).
- Stop Loss: Below the lowest curve point or most recent higher low.
- Target 1: Previous structural high.
- Target 2: Use measured move method—height of the curve projected upward.
- Optional: Trail stop below swing lows to catch extended runs.
“Structure beats hope. Every. Single. Time.” — John Kicklighter, Chief Strategist at DailyFX
The One Trick Most Traders Forget (That Can Double Your Edge)
Here’s a gem most courses skip: Time Compression Zones.
This is where multiple rounding bottoms or consolidation zones stack over time on the daily chart. When price finally breaks out? Momentum bursts like a shaken soda can.
Track how long the pattern takes to form. If the right side of the curve forms twice as fast as the left, that’s your cue. Momentum is accelerating. Combine this with increasing volume and boom—market ignition.
Let’s Talk Smart Money: What They’re Doing While You’re Doubting
Institutions love the daily timeframe. It’s where they accumulate without leaving footprints. The rounding bottom becomes their trapdoor play: while retail traders are focused on shorting “resistance,” institutions are absorbing liquidity right under their noses.
Use tools like COT reports, volume profile, and market sentiment indicators to align your trades with the big dogs.
Want to level up even more? StarseedFX’s community provides live alerts when patterns like these start forming across major pairs. Get in early. Get in smart.
Bulletproof Checklist: Mastering the Daily Timeframe Rounding Bottom
- ☑ Spot volume contraction and exhaustion in a downtrend
- ☑ Confirm curvature and higher lows forming
- ☑ Look for MACD or RSI divergence
- ☑ Watch for volume spike and resistance breakout
- ☑ Validate with institutional activity (COT/Order Blocks)
- ☑ Use 200 EMA reclaim as bonus confirmation
- ☑ Plan targets with structure + measured move
- ☑ Optional: Stack with macro timing cycles for bonus edge
Closing Thoughts: From Quiet Curves to Loud Profits
Trading the rounding bottom on the daily timeframe isn’t flashy. It’s not a Reddit meme, and it won’t satisfy your dopamine cravings every 60 seconds. But it will make you a better trader—one who plays the long game with precision.
There’s elegance in patience. Power in curves. And profit in spotting what others ignore.
Have you traded a rounding bottom before? Drop your experience or questions in the comments below—and if you want to join a trading circle that talks less fluff and more next-level setups, join the StarseedFX community.
—————–
Image Credits: Cover image at the top is AI-generated
PLEASE NOTE: This is not trading advice. It is educational content. Markets are influenced by numerous factors, and their reactions can vary each time.

Anne Durrell & Mo
About the Author
Anne Durrell (aka Anne Abouzeid), a former teacher, has a unique talent for transforming complex Forex concepts into something easy, accessible, and even fun. With a blend of humor and in-depth market insight, Anne makes learning about Forex both enlightening and entertaining. She began her trading journey alongside her husband, Mohamed Abouzeid, and they have now been trading full-time for over 12 years.
Anne loves writing and sharing her expertise. For those new to trading, she provides a variety of free forex courses on StarseedFX. If you enjoy the content and want to support her work, consider joining The StarseedFX Community, where you will get daily market insights and trading alerts.
Share This Articles
Recent Articles
The GBP/NZD Magic Trick: How Genetic Algorithms Can Transform Your Forex Strategy
The British Pound-New Zealand Dollar: Genetic Algorithms and the Hidden Forces Shaping Currency Pairs
Chande Momentum Oscillator Hack for AUD/JPY
The Forgotten Momentum Trick That’s Quietly Dominating AUD/JPY Why Most Traders Miss the Signal
Bearish Market Hack HFT Firms Hope You’ll Never Learn
The One Bearish Market Hack High Frequency Traders Don't Want You to Know The
