
The Hidden Retail Sales Secret: How the Descending Broadening Wedge Can Predict Market Moves
The retail sector is a goldmine of trading opportunities, yet most traders treat retail sales reports like the weather—glancing at them occasionally and then carrying on as if nothing happened. But what if I told you retail sales data, combined with the descending broadening wedge pattern, could unlock game-changing Forex opportunities? That’s right. Forget about blindly following trendlines—this is the real insider playbook.
The Retail Sales Trap: Why Most Traders Miss the Bigger Picture
Retail sales reports might seem like another economic metric tossed into the mix, but they hold serious weight in Forex trading. Why? Because retail sales act as a real-time pulse check on consumer spending—the backbone of any economy.
Let’s break it down:
- High retail sales = A stronger economy → Potential currency appreciation.
- Low retail sales = A weakening economy → Potential currency depreciation.
Sounds simple, right? Not so fast.
Many traders fall into the trap of reacting to retail sales data without looking at the bigger picture. A single retail sales report can be deceiving. Instead of jumping in after a strong number, the real pros wait to see how it aligns with technical signals—particularly, the descending broadening wedge pattern.
What’s a Descending Broadening Wedge (And Why Should You Care)?
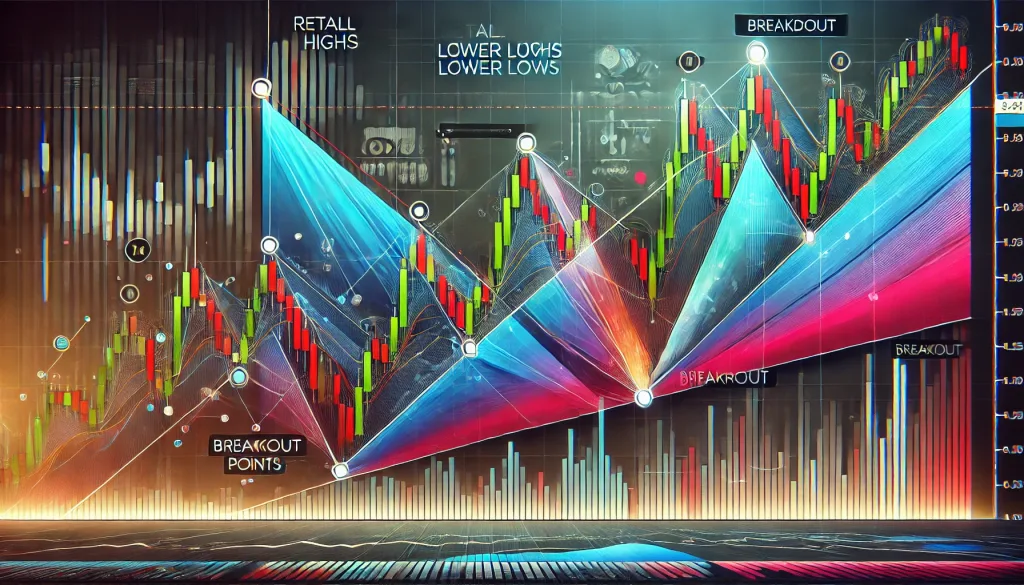
Imagine a trader’s worst nightmare—price moving in erratic, increasingly wider swings, like a rollercoaster that’s malfunctioning. That’s the descending broadening wedge. It forms when price action makes lower highs and lower lows, but with progressively larger swings.
Key Characteristics:
✅ Expanding price swings with downward movement.
✅ Typically forms in bearish trends but signals potential bullish reversals.
✅ Often leads to explosive breakouts when buyers step in.
And here’s where the magic happens: When retail sales data drops, and the market is already forming a descending broadening wedge, it can signal an imminent breakout.
How to Use Retail Sales and the Descending Broadening Wedge for Elite Trades
Let’s get into the real ninja tactics. Here’s how you can combine these two factors to snipe high-probability trades.
1. Identify the Pattern First
Before even looking at retail sales data, scan the charts for a descending broadening wedge. Look for these signs:
- Price making lower highs and lower lows.
- Expanding volatility (swings getting bigger over time).
- Support forming at the bottom of the wedge.
2. Wait for Retail Sales to Act as a Catalyst
Retail sales reports can accelerate breakouts. Here’s the formula:
- Weak retail sales + descending broadening wedge = Potential bullish breakout.
- Strong retail sales + descending broadening wedge = Possible breakdown continuation.
3. Trade the Breakout Like a Pro
Once the market digests the retail sales report, watch for a breakout signal:
- Bullish Breakout Confirmation: Price closes above the upper wedge line with strong momentum.
- Bearish Breakdown Confirmation: Price closes below the wedge with increasing volume.
Set stop-loss levels below recent swing lows for long trades and above swing highs for shorts.
Case Study: When the Market Ignored Retail Sales (And Got Wrecked)
In September 2023, U.S. retail sales data surprised to the downside, coming in at -0.2% instead of the expected 0.3% increase. Many traders rushed to short the USD, assuming weaker consumer spending would lead to dollar depreciation. But here’s what they missed:
???? A descending broadening wedge was already forming on USD/JPY.
???? The weak retail sales report acted as a reversal catalyst.
???? USD/JPY broke out bullishly, trapping shorts and skyrocketing 250+ pips in days.
This is the power of combining technical analysis with fundamental data. Those who saw the wedge pattern forming knew that selling into support was a mistake. Instead, they positioned themselves for the inevitable short squeeze.
Final Thoughts: Trade Smart, Not Impulsively
Retail sales are more than just numbers—they are the fuel that can ignite price action. When paired with the descending broadening wedge, they create some of the best breakout setups you’ll ever find. But the trick is patience and discipline.
Key Takeaways:
✅ Retail sales data reflects consumer spending strength, influencing currency demand.
✅ The descending broadening wedge signals potential reversals, often leading to explosive breakouts.
✅ Smart traders wait for both factors to align before entering trades.
✅ The best setups occur when weak retail sales trigger reversals from a wedge’s support zone.
Want more ninja-level strategies like this? Join the StarseedFX Community for elite insights, daily alerts, and expert analysis: https://starseedfx.com/community
—————–
Image Credits: Cover image at the top is AI-generated
PLEASE NOTE: This is not trading advice. It is educational content. Markets are influenced by numerous factors, and their reactions can vary each time.

Anne Durrell & Mo
About the Author
Anne Durrell (aka Anne Abouzeid), a former teacher, has a unique talent for transforming complex Forex concepts into something easy, accessible, and even fun. With a blend of humor and in-depth market insight, Anne makes learning about Forex both enlightening and entertaining. She began her trading journey alongside her husband, Mohamed Abouzeid, and they have now been trading full-time for over 12 years.
Anne loves writing and sharing her expertise. For those new to trading, she provides a variety of free forex courses on StarseedFX. If you enjoy the content and want to support her work, consider joining The StarseedFX Community, where you will get daily market insights and trading alerts.
Share This Articles
Recent Articles
The GBP/NZD Magic Trick: How Genetic Algorithms Can Transform Your Forex Strategy
The British Pound-New Zealand Dollar: Genetic Algorithms and the Hidden Forces Shaping Currency Pairs
Chande Momentum Oscillator Hack for AUD/JPY
The Forgotten Momentum Trick That’s Quietly Dominating AUD/JPY Why Most Traders Miss the Signal
Bearish Market Hack HFT Firms Hope You’ll Never Learn
The One Bearish Market Hack High Frequency Traders Don't Want You to Know The
