
The WTI Double Top: A Trader’s Guide to Spotting Market Reversals Before They Happen
The Trap That’s Been Catching Traders Since the Dawn of Forex
Imagine this: You’re eyeing the WTI crude oil market, watching price movements like a hawk, feeling invincible. You see price hitting a familiar resistance level and bouncing off like a rubber ball. Then, it does it again. Surely, this means the price will eventually break through, right? WRONG.
This, my friend, is the dreaded double top—one of the most deceptive and devastating patterns in trading. If you don’t know how to spot it, you could be throwing your money into the abyss faster than a reckless gambler at a Las Vegas blackjack table. But fear not, because today, we’re diving deep into the WTI double top, uncovering how to not only recognize it but also use it to your advantage.
What Is a Double Top? (And Why It’s Your Best Friend and Worst Enemy)
The double top pattern is a bearish reversal pattern that forms after an extended uptrend. It consists of two peaks that hit roughly the same resistance level before price reverses. It’s like the market trying to break through a brick wall twice—only to realize it’s not Superman.
Here’s the breakdown:
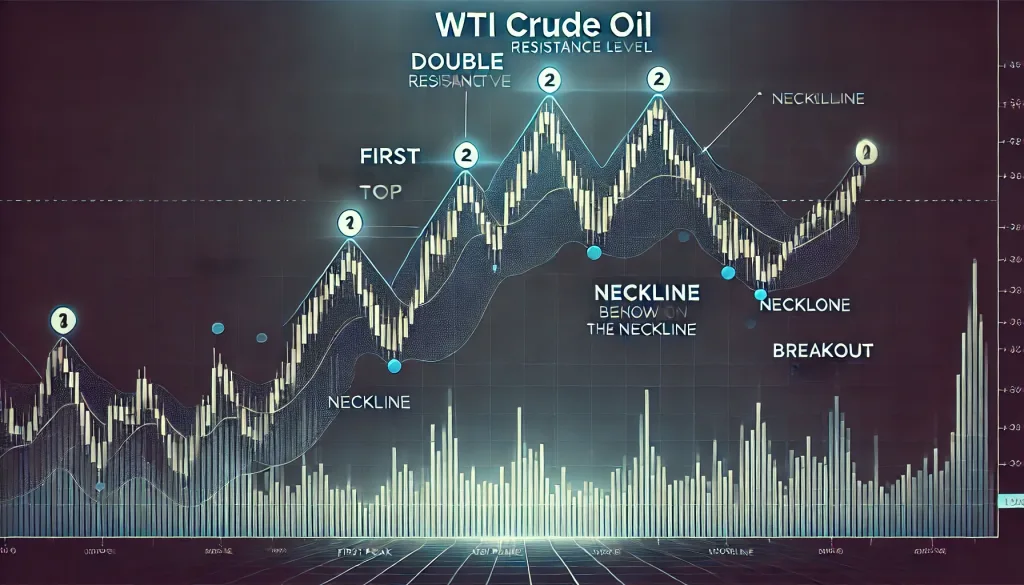
- First Peak: Price rallies and hits a resistance level.
- Pullback: Price retraces slightly before making another attempt.
- Second Peak: Price fails again at the same resistance level.
- Neckline Break: Price falls below the support level (neckline), confirming the reversal.
Why is this pattern so crucial? Because it’s one of the most reliable indicators that a bullish trend is about to run out of steam. And when it appears on WTI crude oil charts, it signals potential massive market shifts that traders can capitalize on.
The Hidden Formula: How to Spot a WTI Double Top Before Everyone Else
Most traders don’t recognize a double top until it’s too late. But the pros? They see it forming in real-time and position themselves accordingly.
1. Identify Key Resistance Zones
Check historical price data. If WTI crude has consistently struggled to break through a particular price level, it’s a red flag. A double top is only valid if both peaks occur at a significant resistance level.
2. Volume Confirmation
A real double top has declining volume at the second peak. Why? Because buyers are losing momentum. If volume remains strong, the pattern could be a fake-out and a breakout might still occur.
3. Neckline Validation
The support level (neckline) must be clearly defined. A double top is only confirmed when price breaks below the neckline with strong selling pressure.
Ninja Tactics: How to Trade the WTI Double Top Like a Pro
So you’ve spotted a double top on the WTI chart. Now what? Here’s how to trade it effectively:
1. Wait for the Neckline Break (Patience Pays)
Jumping in too early can backfire. Instead, wait for price to break below the neckline and close beneath it. This confirms the pattern and reduces the risk of a false breakout.
2. Use a Retest for a Safer Entry
Often, price will come back to retest the neckline after breaking it. This is your golden opportunity to enter with a high-probability trade setup.
3. Set Strategic Stop-Loss and Take-Profit Targets
- Stop-Loss: Place it just above the second peak to avoid being shaken out by market noise.
- Take-Profit Target: Measure the distance between the peaks and neckline. This distance is your projected price drop after the neckline break.
The Underground Secrets: Why Most Traders Fail (And How You Can Win)
Most traders get wrecked by double tops because they:
- Ignore volume trends. A true double top has lower volume on the second peak.
- Get impatient. They enter too early, only to get faked out by a false breakdown.
- Forget about market conditions. If WTI crude oil is in a highly volatile environment due to news or OPEC decisions, the pattern can be unreliable.
The best traders adapt. They combine technical patterns with fundamental analysis, market sentiment, and smart risk management.
Case Study: The 2023 WTI Double Top Collapse
Let’s take a real-world example. In mid-2023, WTI crude oil formed a textbook double top around $90 per barrel. Traders who recognized this pattern had a massive opportunity to short the market. Once the neckline at $82 broke, WTI plunged to $74 within weeks. Those who followed the strategy pocketed serious gains.
Final Thoughts: Master the Double Top, Master the Market
The double top is not just another pattern—it’s a market cheat code when used correctly. Master it, and you’ll be one step ahead of the herd, positioning yourself for massive wins while others get caught in the trap.
Want to sharpen your trading edge even further? Join the StarseedFX Community for expert analysis, daily alerts, and exclusive insights:
—————–
Image Credits: Cover image at the top is AI-generated
PLEASE NOTE: This is not trading advice. It is educational content. Markets are influenced by numerous factors, and their reactions can vary each time.

Anne Durrell & Mo
About the Author
Anne Durrell (aka Anne Abouzeid), a former teacher, has a unique talent for transforming complex Forex concepts into something easy, accessible, and even fun. With a blend of humor and in-depth market insight, Anne makes learning about Forex both enlightening and entertaining. She began her trading journey alongside her husband, Mohamed Abouzeid, and they have now been trading full-time for over 12 years.
Anne loves writing and sharing her expertise. For those new to trading, she provides a variety of free forex courses on StarseedFX. If you enjoy the content and want to support her work, consider joining The StarseedFX Community, where you will get daily market insights and trading alerts.
Share This Articles
Recent Articles
The GBP/NZD Magic Trick: How Genetic Algorithms Can Transform Your Forex Strategy
The British Pound-New Zealand Dollar: Genetic Algorithms and the Hidden Forces Shaping Currency Pairs
Chande Momentum Oscillator Hack for AUD/JPY
The Forgotten Momentum Trick That’s Quietly Dominating AUD/JPY Why Most Traders Miss the Signal
Bearish Market Hack HFT Firms Hope You’ll Never Learn
The One Bearish Market Hack High Frequency Traders Don't Want You to Know The
