
Supertrend Indicator Secrets for the 1-Hour Timeframe
The Little-Known Supertrend Indicator Tactics for the 1-Hour Timeframe
When it comes to trading, many tools get hyped up, then fizzle out like a forgotten trend. Not the Supertrend Indicator. Used right, especially on the 1-Hour Timeframe, it can transform your trading game from clueless guessing to sniper-like precision. Think of it as that undervalued stock that quietly turns millionaires into billionaires. The key? Knowing the insider tactics the pros don’t tell you.
Let’s peel back the curtain and uncover the little-known secrets that could change how you trade forever.
Why the 1-Hour Timeframe is the Sweet Spot for Supertrend
If you’ve ever traded on a 5-minute chart, you know the pain of wild swings. It’s like babysitting a toddler hopped up on sugar – exhausting and chaotic. Enter the 1-Hour Timeframe. It offers the perfect balance:
- Smoother Price Movements: Less noise, clearer signals.
- Reliable Trends: It reduces false breakouts that haunt lower timeframes.
- Time-Efficient: You can analyze setups and trade without being glued to your screen like a Netflix addict.
In short, the 1-hour chart gives you breathing room while still delivering opportunities to catch significant moves.
Quick Tip: Pairing Supertrend with the 1-hour chart filters out intraday noise, allowing you to focus on actual trends.
Supertrend: Not Your Average Indicator
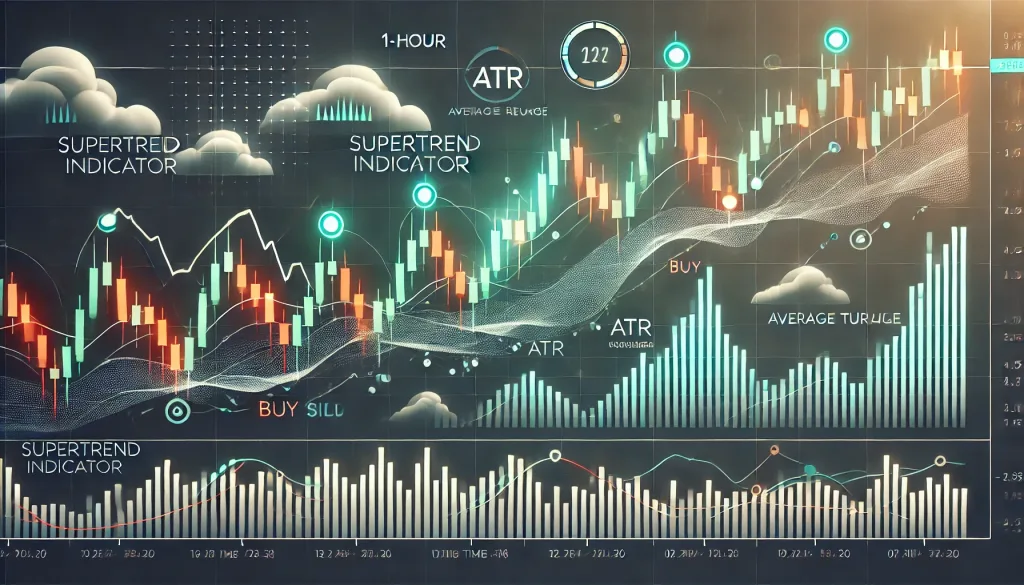
The Supertrend Indicator may look like just another colorful line on your chart, but it’s smarter than it appears. Based on ATR (Average True Range), it adjusts dynamically to market volatility. This means when price action heats up, the Supertrend line widens; when it cools, the line tightens.
Translation? It’s like having an adaptive stop-loss that “reads the room” better than you do.
Here’s how it works:
- When price moves above the Supertrend line – it’s a buy signal.
- When price moves below the Supertrend line – it’s a sell signal.
Simple, right? But here’s where most traders get it wrong…
Where Most Traders Fail (and How You Can Avoid It)
Blindly Trusting the Supertrend
The biggest mistake? Treating Supertrend signals like gospel. Imagine buying a house just because the realtor says it’s “a steal” without inspecting the foundation. That’s what happens when traders ignore confirmation signals.
Fix It: Combine Supertrend with these powerful tools:
- 50 EMA: Check if price is above the 50 EMA for bullish setups and below for bearish ones.
- RSI (Relative Strength Index): Use RSI to confirm momentum. For example, ensure RSI > 50 for buy signals.
Ignoring Volatility Shifts
Market volatility isn’t static. When the ATR spikes, the Supertrend line widens, and your stop-loss increases. But many traders set rigid stop-losses, only to watch them get obliterated.
Pro Tactic: Adjust your risk management to match the ATR. For example:
- If ATR = 20 pips, set your stop-loss slightly beyond the Supertrend line (25-30 pips).
- If ATR doubles, adapt your position size to manage risk.
Overtrading Low-Probability Setups
If you enter every Supertrend signal, you’re throwing spaghetti at the wall and hoping something sticks. This strategy may work for dinner prep but not for trading.
Fix It: Only trade setups that align with:
- Key Levels: Support, resistance, or trendlines.
- Price Action Patterns: Look for breakouts, pin bars, or engulfing candles near the Supertrend line.
The Insider Playbook: Mastering Supertrend on the 1-Hour Chart
Now that we’ve busted common myths, here’s a ninja-level strategy you can apply today:
Step-by-Step Strategy
- Identify the Trend: Use the Supertrend indicator to spot buy or sell signals.
- Confirm with 50 EMA: Ensure the price aligns with the Supertrend signal (above for buys, below for sells).
- Volatility Check: Measure the current ATR value to adjust your stop-loss and position size.
- Look for Triggers: Wait for price action confirmation (e.g., bullish engulfing or breakout candle).
- Place Entry: Enter only after confirmation, with a stop-loss beyond the Supertrend line.
- Trail the Stop-Loss: As price moves in your favor, use the Supertrend line as a trailing stop.
Real-World Example: Turning $1,000 into $3,000
Let’s make this practical. Imagine you’re trading EUR/USD on the 1-hour chart. Here’s what happens:
- Supertrend Goes Bullish: Price closes above the Supertrend line at 1.0800.
- Confirmation: Price is also above the 50 EMA, and RSI reads 55.
- ATR Check: ATR = 20 pips. You set your stop-loss at 1.0780 and your target at 1.0860 (3:1 risk-reward).
- Outcome: Price hits your target, and your $1,000 position grows to $3,000.
Simple execution. Strategic edge. That’s the power of combining Supertrend with confirmation tools.
Most traders stick with the default Supertrend settings (Period: 10, Multiplier: 3). Here’s the thing – tweaking these settings can give you an edge:
- For Trending Markets: Use Period: 7, Multiplier: 2.5 for faster signals.
- For Ranging Markets: Use Period: 14, Multiplier: 4 for more reliable signals.
Pro Tip: Test these variations on your charts and fine-tune them based on currency pair volatility.
Final Thoughts: Why Supertrend on the 1-Hour Timeframe is a Game-Changer
By mastering the Supertrend indicator on the 1-hour chart, you gain a strategic edge that most traders overlook. It’s simple, adaptable, and (when paired with confirmation) deadly accurate.
Here’s what you’ve learned:
- Why the 1-hour chart is perfect for Supertrend.
- Common pitfalls traders fall into (and how to dodge them).
- An insider playbook for high-probability trades.
- Hidden Supertrend settings most traders ignore.
So, ditch the noisy 5-minute charts and level up your trading with the Supertrend on the 1-hour timeframe. Your account (and sanity) will thank you.
Want More Insider Tactics?
- Get daily Forex insights and exclusive strategies at StarseedFX Community.
- Grab our Free Trading Plan to refine your goals and master risk management here.
- Track your trades like a pro with the Free Trading Journal at this link.
—————–
Image Credits: Cover image at the top is AI-generated
PLEASE NOTE: This is not trading advice. It is educational content. Markets are influenced by numerous factors, and their reactions can vary each time.

Anne Durrell & Mo
About the Author
Anne Durrell (aka Anne Abouzeid), a former teacher, has a unique talent for transforming complex Forex concepts into something easy, accessible, and even fun. With a blend of humor and in-depth market insight, Anne makes learning about Forex both enlightening and entertaining. She began her trading journey alongside her husband, Mohamed Abouzeid, and they have now been trading full-time for over 12 years.
Anne loves writing and sharing her expertise. For those new to trading, she provides a variety of free forex courses on StarseedFX. If you enjoy the content and want to support her work, consider joining The StarseedFX Community, where you will get daily market insights and trading alerts.
Share This Articles
Recent Articles
The GBP/NZD Magic Trick: How Genetic Algorithms Can Transform Your Forex Strategy
The British Pound-New Zealand Dollar: Genetic Algorithms and the Hidden Forces Shaping Currency Pairs
Chande Momentum Oscillator Hack for AUD/JPY
The Forgotten Momentum Trick That’s Quietly Dominating AUD/JPY Why Most Traders Miss the Signal
Bearish Market Hack HFT Firms Hope You’ll Never Learn
The One Bearish Market Hack High Frequency Traders Don't Want You to Know The
