
Yearly Ascending Triangle: The Hidden Patterns Only Experts Know
Alright, let’s crack open a year’s worth of market movement and uncover why the yearly ascending triangle is like the hidden stash of your grandma’s cookie jar—full of sweet opportunities that most people overlook. Forget the overused RSI and Bollinger Bands, today we’re talking about a pattern that’s been waving at you all year long while you were busy looking elsewhere. The ascending triangle isn’t just another chart shape; it’s a road map for predicting the big market moves, and it’s time to turn those lines into gold mines.
Why Most Traders Miss the Ascending Triangle on a Yearly Chart (And How You Can Spot It)
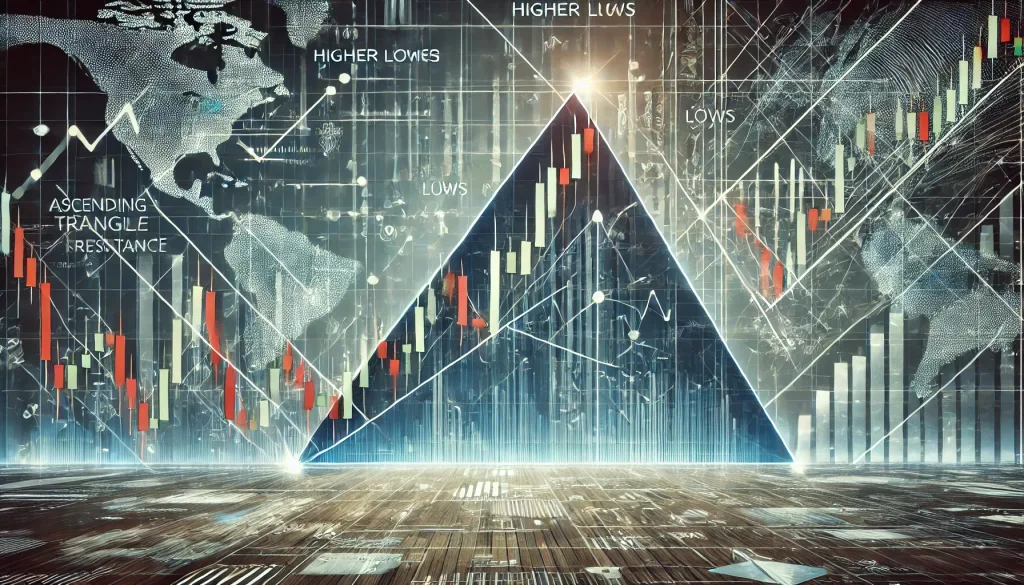
Imagine this: most traders are like people waiting for a bus at the wrong stop. They’re analyzing minute-by-minute charts, sweating over hourly candles, and completely missing the big picture. The yearly ascending triangle forms gradually, and it’s like the universe’s way of saying, “Hey, relax and look at the bigger story.” It happens when the price makes a series of higher lows while being capped by a nearly horizontal resistance level. Once that ceiling breaks, fireworks tend to follow.
Think about it: it’s like putting pressure on a soda bottle. You shake it long enough, and when the cap finally gives, there’s no stopping the explosion. The yearly ascending triangle is the market’s version of a pressure cooker, ready to pop—and we’re here to be on the right side of that release.
The Secret to Spotting the Yearly Ascending Triangle Early
Here’s the secret sauce that’ll make you look like a chart whisperer. Most traders only look at daily or weekly charts, but there’s a certain magic in zooming out to yearly charts. When you spot price action pressing against a key resistance level with those higher lows stacking like perfectly folded laundry, you’re onto something big.
Think of it like hiking—if you’re too close to the ground, every pebble feels like an obstacle. But zoom out, and suddenly, you see the whole path clearly. A yearly chart lets you step back, assess the landscape, and spot the path of least resistance. That’s your ascending triangle, hinting at a big breakout.
When To Make Your Move: Timing is Everything
You’ve heard it before: timing the market beats timing in the market. And boy, is that true for the yearly ascending triangle. The breakout point—when the price finally breaches the resistance line—is your golden ticket. But let’s keep it real; false breakouts happen, and they can sting worse than a bee at a summer picnic.
To avoid that, look for strong volume. If the price is breaking out, but the volume’s thinner than a fashion model’s lunch, that’s a red flag. Ideally, you’re waiting for volume to spike alongside the breakout—like that last-minute holiday shopping rush, but in a good way. This is where using tools like the StarseedFX Smart Trading Tool comes in handy—automated order management with real-time volume insights could save you from mistaking a fake breakout for the real deal.
Expert Insights: What The Pros Say About the Yearly Ascending Triangle
According to John Murphy, author of Technical Analysis of the Financial Markets, ascending triangles are bullish continuation patterns. And when they show up on yearly charts, they often precede massive shifts in market sentiment. Murphy says, “The longer the time frame of the pattern, the more significant the breakout.” That’s why this isn’t just some daily trader’s play; this is where the big money lives.
Another expert, Kathy Lien, a veteran in Forex analysis, notes that yearly ascending triangles can signal underlying strength even if economic data paints a shaky picture. “When prices create higher lows over an extended period, it’s usually due to institutional buying,” she says. And you know what they say—follow the smart money.
Myth Busting: “Yearly Patterns Are Irrelevant”
One of the biggest misconceptions is that long-term patterns are only for investors, not traders. Let’s debunk that myth right now. Yearly ascending triangles give traders a chance to position themselves early, ahead of retail FOMO. Remember, being first isn’t just for getting the best seat in the house; it’s about getting in before the crowd jacks up the price.
Think of the yearly ascending triangle like a bakery opening—the earlier you get there, the fresher (and cheaper) the bread. Most traders are like those who wait until after noon; by then, everything good is gone, and prices are inflated. You want to be there at dawn, ready for the breakout batch.
A Real-World Example: EUR/USD Yearly Ascending Triangle
Consider the EUR/USD pair in 2017-2020. Over three years, it formed an ascending triangle, pressing repeatedly against the 1.20 resistance level while consistently making higher lows. By late 2020, it broke through with momentum that saw the pair rally to nearly 1.23—that’s a substantial move if you’re geared up with leveraged positions.
This wasn’t some random miracle; it was a textbook breakout from a yearly ascending triangle. Traders who spotted the pattern had ample time to prepare, build their positions, and profit from the resulting move.
Next-Level Tactics for Trading the Yearly Ascending Triangle
- Patience is Your Best Friend: The yearly ascending triangle takes time—a lot of it. But the payout for that patience can be massive. Set alerts at key levels instead of constantly staring at the charts.
- Risk Management, Ninja Style: Use stop-loss orders just below the most recent higher low. This way, you minimize damage if the market decides to break bad like a poorly directed sitcom plot twist.
- Use Volume as Confirmation: Without volume, the breakout is just a rumor. Check volume indicators to see if it’s really breaking out or just trying to trick you. If it feels fishy, it probably is.
- Automated Tools: Leveraging something like the Smart Trading Tool from StarseedFX can give you a leg up. It helps automate lot size calculation and manages orders, making sure you don’t get caught off guard by unexpected moves.
The Ascending Triangle: Why You Should Care
An ascending triangle on a yearly chart is like finding a diamond in the rough. It’s a pattern that’s often overlooked simply because it requires patience and a broader view. But if you’re looking for those game-changing trades that make a difference over the long haul, this is your strategy.
Think of the market like an iceberg—most people only see what’s above water, but the real mass is underneath. Yearly ascending triangles give you a peek below the surface, revealing where the smart money is going before everyone else catches on.
Your Turn: Time to Put This Knowledge to Work
Now that you’ve got the lowdown on the yearly ascending triangle, it’s time to start scanning those charts. Take a step back, look at the big picture, and spot the formations that could set you up for the kind of breakout trades others only dream about. And if you need tools to help along the way, don’t forget that StarseedFX has you covered—from smart trading tools to expert insights.
Let’s make those lines work for you, not against you. And remember, trading isn’t just about charts and patterns; it’s about seeing what others miss. Get out there, take a broader look, and stay one step ahead.
—————–
Image Credits: Cover image at the top is AI-generated
PLEASE NOTE: This is not trading advice. It is educational content. Markets are influenced by numerous factors, and their reactions can vary each time.

Anne Durrell & Mo
About the Author
Anne Durrell (aka Anne Abouzeid), a former teacher, has a unique talent for transforming complex Forex concepts into something easy, accessible, and even fun. With a blend of humor and in-depth market insight, Anne makes learning about Forex both enlightening and entertaining. She began her trading journey alongside her husband, Mohamed Abouzeid, and they have now been trading full-time for over 12 years.
Anne loves writing and sharing her expertise. For those new to trading, she provides a variety of free forex courses on StarseedFX. If you enjoy the content and want to support her work, consider joining The StarseedFX Community, where you will get daily market insights and trading alerts.
Share This Articles
Recent Articles
The GBP/NZD Magic Trick: How Genetic Algorithms Can Transform Your Forex Strategy
The British Pound-New Zealand Dollar: Genetic Algorithms and the Hidden Forces Shaping Currency Pairs
Chande Momentum Oscillator Hack for AUD/JPY
The Forgotten Momentum Trick That’s Quietly Dominating AUD/JPY Why Most Traders Miss the Signal
Bearish Market Hack HFT Firms Hope You’ll Never Learn
The One Bearish Market Hack High Frequency Traders Don't Want You to Know The
