
The RSI & USDJPY: Uncovering Little-Known Secrets for Next-Level Profits
The Secret Sauce: RSI and USDJPY Magic
Imagine the RSI as your overenthusiastic friend. It’s that guy who tells you at a party when you’ve had too much to drink or that you’ve danced too little. And when we’re talking about trading the USDJPY pair, that same friend (the RSI) has some next-level, sneaky ways to show you what the market is up to—like having a crystal ball, minus the mystical fog and mysterious lady with a cat.
The RSI, or Relative Strength Index, is not just your typical indicator. In Forex, it’s like a rare Pokémon: common enough for everyone to have heard of, but most people barely scratch the surface of its true potential. When you pair it with the USDJPY—one of the most liquid currency pairs—you get a toolkit that’s practically screaming for a promotion. In this post, we’ll dive into advanced, lesser-known trading techniques to maximize RSI’s potential with USDJPY. Just promise me—no more clicking the ‘sell’ button just because it feels right. Let’s work with strategy here.
Overbought and Oversold? More Like Overhyped!
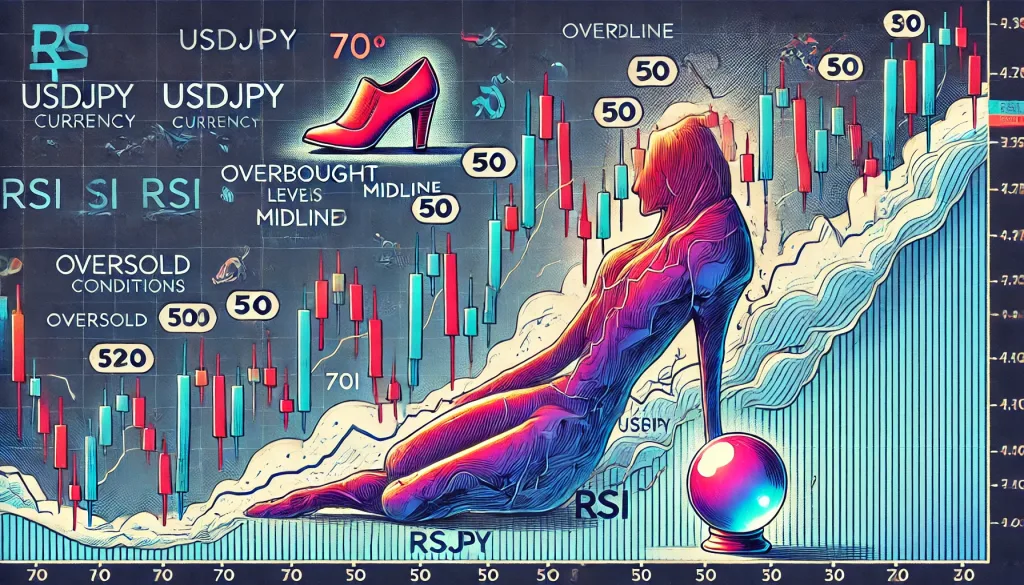
Ah yes, the classic RSI setup—”If RSI hits 70, SELL. If RSI hits 30, BUY.” That’s cute, but also one of the biggest pitfalls traders get tangled in. Picture this: buying USDJPY because the RSI hit 30, only to watch it keep plummeting. It’s like buying a pair of fancy shoes on sale only to realize there’s no real occasion to wear them. The RSI isn’t a be-all-end-all indicator. It needs context—kind of like knowing whether your boss is in a good mood before cracking that office joke.
The Divergence Dance: When RSI Speaks in Code
Ever heard of divergence? Well, of course you have. But are you really using it to its full advantage with USDJPY? RSI divergence happens when price action and RSI have a good old-fashioned disagreement. Imagine USDJPY climbing higher and higher, but the RSI, sitting on the sidelines, says, “Nah, bro, I’m not that strong.” That’s called bearish divergence—an early warning sign that the uptrend could be fizzling out.
Now, think of bullish divergence, which occurs when USDJPY keeps dipping lower, but RSI starts showing strength. It’s like that motivational friend who cheers you up after a bad day—a sign that maybe the market isn’t as grim as it looks. These divergence signals are like those hidden cheats in an old video game—they aren’t obvious, but they sure make a difference if you know where to find them.
The Hidden Patterns That Drive the Market
Let’s talk about RSI cycles. Have you ever noticed how USDJPY moves like it’s keeping a rhythm? That’s because markets aren’t entirely chaotic. The RSI helps uncover these hidden patterns that show up during different market sessions. For USDJPY, the overlap between the Tokyo and London sessions can be particularly volatile. During these hours, RSI often signals exaggerated moves—meaning you can expect sharp breakouts. Trading on these cycles is like joining a flash mob—you need to know when to jump in, and when to leave, before the crowd starts thinning out.
Another hidden pattern involves the RSI midline—the 50 mark. Many traders overlook this, but when USDJPY moves above or below 50, it’s like flipping a switch. Above 50? Think “bullish control.” Below 50? It’s “bearish territory.” These shifts can give you better context than simply relying on 70 or 30.
The Forgotten Strategy That Outsmarted the Pros
Here’s something that might surprise you: some of the best moves in USDJPY happen when RSI hovers around 60 or 40. Why? Because these areas represent continuation rather than reversal. It’s like watching a detective movie—instead of focusing on the dramatic plot twist, you start paying attention to the subtle clues that build up along the way. Many retail traders make the mistake of betting against the trend the moment RSI hits 60. But seasoned pros? They know the real money is made when you hop in the trend, not when you try to predict its funeral.
Picture this: USDJPY is in an uptrend, and RSI is chilling at 62. Most traders scream “overbought!” and jump ship. But the pro traders sit tight, like someone who already knows the second half of a magic trick—because trends don’t die at 60; they thrive there.
How to Predict Market Moves with Precision
Let’s sprinkle a bit of algorithmic fairy dust here. The RSI can actually be optimized to give you even better insights for USDJPY. Most traders use a 14-period RSI, but for our USDJPY-focused ninja tactics, testing different periods (like 7 or 21) can provide a clearer picture. The 7-period RSI, for instance, gives faster signals—it’s like a Formula 1 car compared to your average sedan. You’ll get more signals, but they might be more erratic. Meanwhile, the 21-period RSI can be a bit of a slower, wiser mentor—helpful when you want to see the bigger picture and avoid false signals.
Moreover, combining RSI with other indicators, like Moving Average Convergence Divergence (MACD), can help you avoid getting faked out. For instance, if RSI is bullish but MACD disagrees, it’s like having two friends disagree over which movie to watch—maybe it’s time to just stay in.
Why Most Traders Get It Wrong (And How You Can Avoid It)
Most traders have this unhealthy obsession with trying to catch tops and bottoms. If RSI hits 70, they sell—hoping the market is going to reverse, only to watch it keep rising and taking their account balance along for the ride. The secret here? Don’t get married to RSI 70 and 30. When it comes to USDJPY, think of these levels as more of a “heads up” rather than a hard rule.
Imagine driving and seeing a yellow traffic light. Does it mean you should slam on the brakes? Not necessarily. Sometimes it means you should speed up—especially if you know the light cycle well. Trading with RSI should be similar: look at the bigger picture, like market trends, support, and resistance zones, and combine these with RSI signals for a fuller, clearer view.
The One Simple Trick That Can Change Your Trading Mindset
Here’s a game-changing idea: stop focusing on win rate. Instead, hone in on risk-to-reward ratios. Most people see RSI giving a buy signal, and they instantly imagine the green pips rolling in. But professional traders think differently. They ask, “What’s my potential upside here versus my downside?” When you trade USDJPY, try using RSI to find areas with good risk-to-reward setups—not just signals. That’s how you transform trading from a slot machine into a business.
For instance, say RSI gives a bullish signal on USDJPY, but you’re approaching a significant resistance zone. It might be wise to wait for a better entry point—a classic “buy the dip” scenario—instead of jumping in right away. This approach is all about patience—because sometimes, the best trading action is no action at all.
Wrap-Up: Are You Ready to Rethink RSI?
The RSI is often misunderstood, misused, or just flat-out ignored when traders get overwhelmed by all the other shiny indicators out there. But with USDJPY, it can be the linchpin of a successful strategy. Remember, it’s not just about knowing when RSI says “overbought” or “oversold.” It’s about reading between the lines—understanding divergence, using continuation signals, recognizing session rhythms, and, most importantly, managing your risk like a pro.
Ready to take your trading to the next level? Consider joining our StarseedFX community for live analysis, expert insights, and alerts that help you harness RSI and much more. Find out more here.
Oh, and don’t forget—RSI might be that helpful friend at the party, but at the end of the day, you are in charge of what you drink—or in this case, what trades you take. Keep your wits about you, stay alert, and happy trading!
—————–
Image Credits: Cover image at the top is AI-generated
PLEASE NOTE: This is not trading advice. It is educational content. Markets are influenced by numerous factors, and their reactions can vary each time.

Anne Durrell & Mo
About the Author
Anne Durrell (aka Anne Abouzeid), a former teacher, has a unique talent for transforming complex Forex concepts into something easy, accessible, and even fun. With a blend of humor and in-depth market insight, Anne makes learning about Forex both enlightening and entertaining. She began her trading journey alongside her husband, Mohamed Abouzeid, and they have now been trading full-time for over 12 years.
Anne loves writing and sharing her expertise. For those new to trading, she provides a variety of free forex courses on StarseedFX. If you enjoy the content and want to support her work, consider joining The StarseedFX Community, where you will get daily market insights and trading alerts.
Share This Articles
Recent Articles
The GBP/NZD Magic Trick: How Genetic Algorithms Can Transform Your Forex Strategy
The British Pound-New Zealand Dollar: Genetic Algorithms and the Hidden Forces Shaping Currency Pairs
Chande Momentum Oscillator Hack for AUD/JPY
The Forgotten Momentum Trick That’s Quietly Dominating AUD/JPY Why Most Traders Miss the Signal
Bearish Market Hack HFT Firms Hope You’ll Never Learn
The One Bearish Market Hack High Frequency Traders Don't Want You to Know The
